

Most apparel resilience work falls apart because teams treat it like insurance they hope never to use. They build a binder, file it somewhere, and move on. Then a fabric mill goes dark the same week a freight lane congests and a trim supplier misses a dye lot — and the binder is useless because it was written for a single clean failure, not the messy correlated ones that actually happen.
Resilience in apparel isn't a document. It's an architecture — a set of connected systems that let you see where your network is thin, understand which failures tend to cluster, and know exactly what to do in the first 24, 72, and 90 hours of a disruption. This article walks through how those pieces fit, where they break as a brand scales, and how to put them together into something you'd actually trust during a rough season.
If you want the tactical, single-event version of this, the capacity-profiled design and tactical failover playbooks cover the narrower failover mechanics. This piece is the layer above that — the system those playbooks plug into.
Why single-point contingency planning keeps failing
Most contingency plans don't survive contact with reality because they model failures as independent events. "If Mill A goes down, switch to Mill B." Clean, simple, wrong.
Failures cluster. A regional labor or power event doesn't take out one supplier — it degrades every supplier in that geography simultaneously, including your backup. A currency swing that makes one sourcing region painful usually hits the neighboring region too. A freight disruption that delays your fabric also delays your trims, your care labels, the sample you needed for fit approval. The correlation is the problem, not the individual node going down.
What tends to show up when you actually map supplier networks is that brands build redundancy that looks diversified on a spreadsheet but isn't. Three fabric sources — all booking capacity at the same two mills during peak. Two freight forwarders — both routing through the same congested port. The redundancy is nominal. Under stress, it collapses.
Resilience architecture starts by refusing to think in isolated nodes. You think in terms of:
-
Capacity — how much real, available throughput each node can give you, and when
-
Correlation — which nodes fail together
-
Buffer — how much slack (time, inventory, cash) sits between a failure and a missed ship window
-
Response — what specific actions fire, and who owns them, in the first hours
Miss any one of these and the other three can't save you.
Capacity profiling: knowing what your network can actually absorb
A capacity profile is an honest answer to a simple question: if demand or disruption spikes, how much can each part of my network actually take without breaking?
Eliminate delays in your fashion production cycle.
GoTailo helps you manage designs, orders, and inventory effortlessly, keeping production on schedule.
- Centralized order and inventory management
- Real-time supplier communication
- Integrated production scheduling
No credit card required
The mistake brands make is treating capacity as a single number — "this factory does 40,000 units a month." That number is meaningless during a disruption because it assumes everything else is normal. Real capacity is conditional. It depends on product type, construction complexity, whether the line is already committed, and whether supporting inputs are available.
A usable capacity profile breaks each critical node into a few dimensions:
| Node | Normal throughput | Surge ceiling (short-term) | Ramp time to surge | Shared dependency |
|---|---|---|---|---|
| Primary cut/sew | ~38k units/mo | ~46k for 2–3 weeks | 10–14 days | Same labor pool as backup line |
| Backup cut/sew | ~22k units/mo | ~26k | 3 weeks | Shares one fabric mill with primary |
| Fabric mill A | 60k yds/mo booked | +15% if pre-ordered | 4–6 weeks | Regional, correlated with mill B |
| Trim supplier | high | effectively uncapped | 1 week | Single-source for one dye recipe |
The "shared dependency" column is the one most teams skip, and it's the one that matters most. The moment you write it down, you start seeing that your "backup" line shares a fabric mill with your primary — so a mill failure takes out both. That's not redundancy. That's a disguised single point of failure.
Refresh capacity profiles ahead of each major booking window to keep surge ceilings accurate.
Capacity profiles also degrade over time if you don't maintain them. A factory that could surge last season may have taken on new accounts and lost that slack. Profiles need a refresh cadence — usually ahead of each major booking window — or they quietly become fiction.
Correlated-risk mapping: the heatmap that changes decisions
Once you have capacity profiles, the next layer is figuring out which nodes fail together. This is where a correlated-risk heatmap earns its keep.
The idea is straightforward: list your critical nodes down one axis and across the other, then score how likely a failure in one is to coincide with a failure in another. You're not looking for precision — you're looking for clusters.
A typical mapping exercise surfaces things like:
-
Geographic correlation — three suppliers in the same industrial zone share weather, labor, power, and political risk. One event hits all three.
-
Input correlation — two factories that look independent both buy from the same yarn spinner. A spinner problem is a double hit.
-
Financial correlation — several of your suppliers are small and undercapitalized. A credit tightening or a slow-paying season stresses all of them at once. (This ties directly into how you structure terms and cash buffers, which overlaps with making your P&L and cashflow predictable through operational finance.)
-
Calendar correlation — every supplier in your network is slammed during the same pre-holiday window, so your "backup capacity" evaporates exactly when you need it.
The heatmap's job isn't to be exhaustively accurate. It's to force uncomfortable conversations. When you color in a cluster of high-correlation cells, you've found the part of your network that your contingency binder was quietly pretending didn't exist.
One pattern worth flagging: the most dangerous correlations are usually invisible on an org chart. Two suppliers with no contractual relationship can still be deeply correlated through a shared sub-tier vendor two levels down. Mapping only your direct suppliers hides this. For your most critical inputs, you want visibility at least one tier deeper.
Buffer math: turning uncertainty into a number you can defend
Capacity profiles tell you what you have. Risk maps tell you what can fail together. Buffer math tells you how much slack you need to hold so a correlated failure doesn't turn into a missed window.
Buffers come in three forms, and strong resilience architectures use all three:
Time buffer. Extra days built into the critical path so a delay doesn't cascade into a chargeback. The right size depends on your lead-time variability, not your average. If a step averages 30 days but swings between 25 and 45, your buffer has to respect the 45, not the 30.
Inventory buffer. Safety stock of long-lead or high-correlation inputs — the base fabric everyone uses, the trim with a single dye recipe. You don't buffer everything. You buffer the items where the cost of running out dwarfs the cost of holding.
Cash buffer. The one teams forget. When a disruption hits, resilience actions cost money — expedited freight, a surge order at a premium, a second sample round. If you don't have cash set aside for contingency, your "plan" is just a wish.
-
Take the node's lead-time variability — not the average, the realistic worst-case spread.
-
Multiply by your daily consumption rate to get the inventory you'd need to cover the gap.
-
Adjust up for correlation — if this input fails alongside others, recovery will be slower and you need more runway.
-
Adjust down for substitutability — if you can swap to an alternate easily, you need less.
-
Translate the result into both units (inventory) and dollars (cash set-aside).
Putting it in dollars is the whole point. A buffer you can't fund isn't a buffer.
A quick example: a brand running roughly 4,000 units a month on a core knit program found their base fabric swung between 28 and 46 days lead time. Averaging gave them a 32-day plan, which failed about one season in three. Sizing to the realistic spread meant holding about three extra weeks of that fabric — somewhere around $18k–$22k in tied-up inventory. Annoying to carry. Far cheaper than the chargebacks and air-freight they'd been eating when the program missed its window.
The 24 / 72 / 90-hour runbooks
Profiles, maps, and buffers are the quiet infrastructure. Runbooks are what you grab when the alarm goes off. The reason to split them by time horizon is that the right action at hour 2 is completely different from the right action at hour 70.
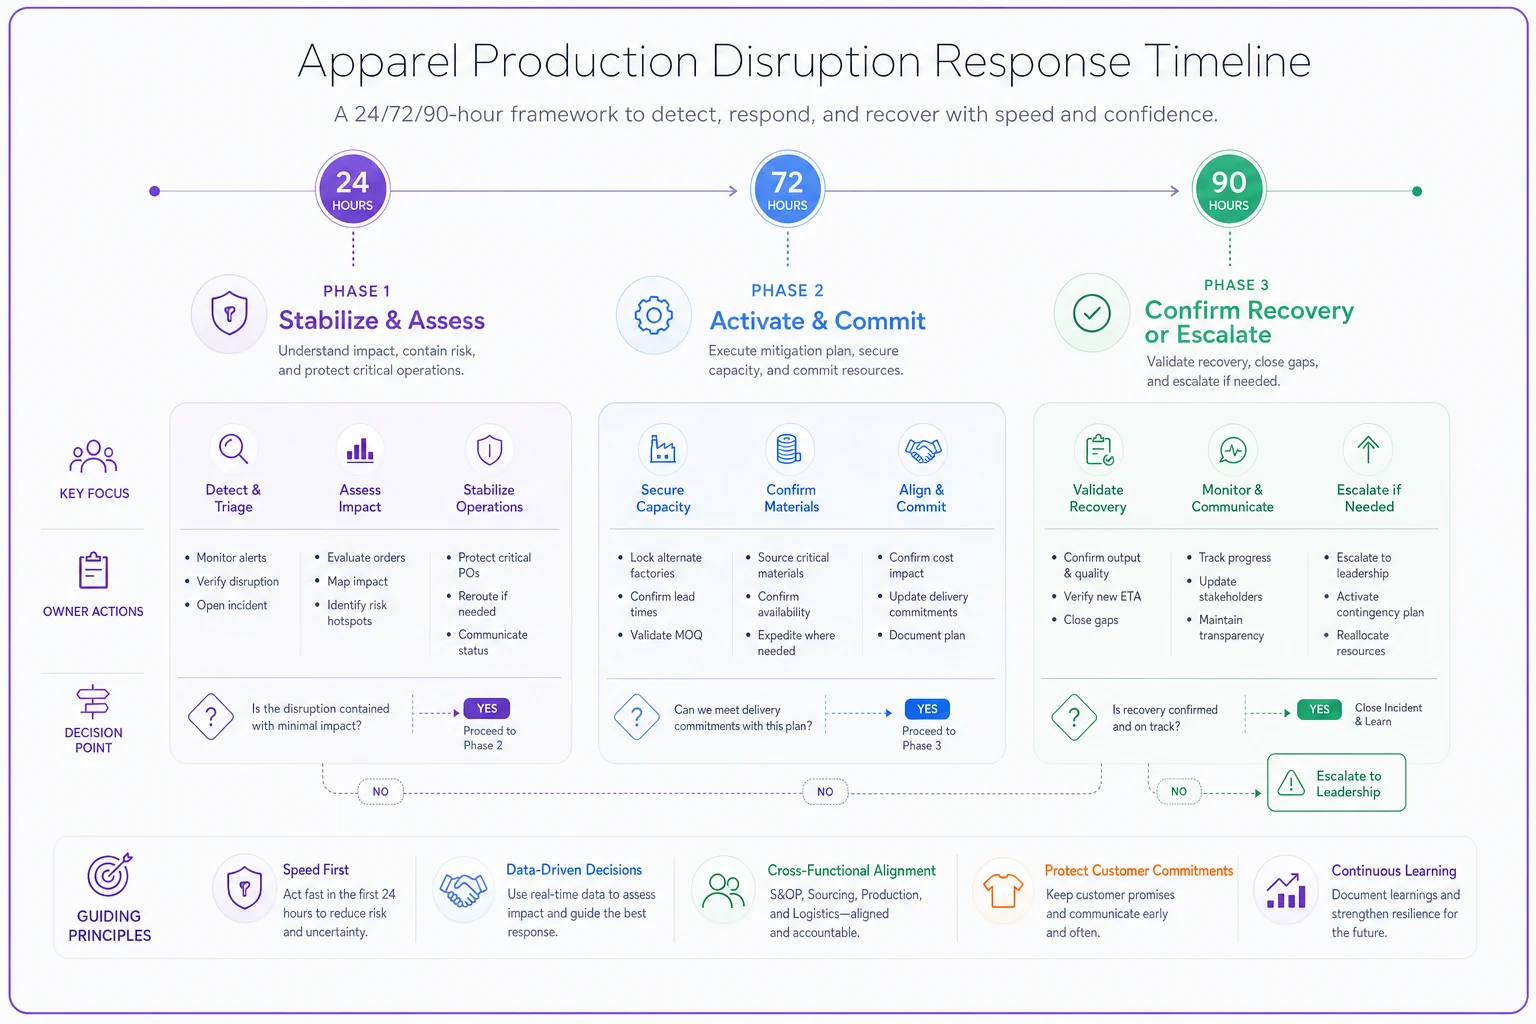
A compact timeline helps keep the phases and owner actions clear during a disruption.
The first 24 hours: stabilize and assess
-
Confirm the failure is real and scope it — which nodes, which SKUs, which ship windows are exposed
-
Freeze any decisions that can't be reversed (don't cancel bookings yet, don't reroute freight yet)
-
Pull the relevant capacity profile and check which backups are genuinely available right now
-
Check the correlated-risk map — is this an isolated node or the leading edge of a cluster?
-
Notify the small group of people who need to know, and nobody who doesn't
The discipline here matters. The temptation in the first few hours is to start moving things. That instinct usually makes it worse.
The 72-hour window: activate and commit
-
Commit to a failover path based on the first-24 assessment
-
Release buffer inventory and confirm it's moving
-
Execute finance-aligned hedging actions — approve the contingency cash, authorize premium freight, lock surge pricing before it climbs
-
Re-sequence the production calendar around the new reality
-
Set a clear checkpoint for the 90-hour review
By 72 hours you should be moving. This is where you execute failover — shifting volume to backup capacity, releasing buffer inventory, triggering pre-negotiated surge agreements. The faster, event-specific mechanics here overlap with a 48–72-hour emergency failover checklist for time-critical SKUs, which is worth keeping alongside this runbook.
The 90-hour review: confirm recovery or escalate
By roughly 90 hours you know whether your actions are working. Either the recovery path is holding and you're managing it down, or it isn't and you need to escalate — pull a window, renegotiate a delivery date with the retailer, or accept a partial shipment. The 90-hour mark exists to force a real decision instead of letting a half-working plan drift into a missed window.
This is the point where most teams either regain control or lose it for the rest of the season. The mark doesn't have to be exactly 90 hours — it's more about having a hard checkpoint rather than letting optimism substitute for a decision.
Finance-aligned hedging: resilience that doesn't wreck the P&L
There's a tension nobody likes to name: every resilience action costs margin. Holding buffer inventory ties up cash. Surge orders come at a premium. Air freight is brutal. If you make these calls purely on operational instinct, you can "save" a launch while quietly destroying its profitability.
Finance-aligned hedging means every contingency action has a pre-agreed cost ceiling tied to the economics of the SKU or program. Before the season, you decide: for this program, we'll spend up to this much on expedite and premium capacity to protect the window, because the margin and retailer relationship justify it. For that program, we won't — we'll take the late penalty instead, because the math says so.
Making this call in advance is the whole point. In the middle of a disruption, under pressure, with a buyer emailing you hourly, nobody makes good margin decisions. The decision has to be pre-made and written into the runbook.
When this full architecture makes sense — and when it's overkill
When it makes sense: You're placing enough volume that a missed window costs real money in chargebacks or lost sell-through. You have multiple programs running concurrently, so disruptions overlap. You've already had at least one season where a correlated failure hurt you and you're not interested in a repeat.
When it's overkill: You're a small brand running one or two drops a year with generous lead times and forgiving channels. At that scale, a lightweight single-point failover plan is plenty — building full capacity profiles and correlated heatmaps is effort you can't yet amortize.
Who should not do this: Teams that haven't yet nailed the basics — reliable lead-time data, a working production calendar, clean supplier records. Resilience architecture is a layer on top of functioning operations. Built on a shaky foundation, the profiles and maps will be full of bad data, and a bad map is more dangerous than no map because it creates false confidence.
A short real scenario
A mid-sized contemporary brand — roughly 30 SKUs a season across two core programs — kept getting burned by what looked like unrelated supplier problems. One season a fabric delay, the next a trim miss, the next a factory capacity crunch. Each got handled as a one-off.
When they finally mapped correlation, the pattern was obvious: their two "independent" cut-and-sew partners both booked the same regional fabric mill, and everything peaked in the same six-week pre-holiday window. Their redundancy was theater.
They did three things. They re-sourced one program's fabric to break the shared dependency. They sized a real buffer on their core base cloth — about three extra weeks of coverage, carrying cost in the low five figures. And they wrote a 24/72/90 runbook with pre-approved contingency cash capped at a percentage of program margin.
The next peak season still had a disruption — a freight delay that would have blown a window the year before. This time the buffer absorbed it, the runbook fired on day one, and the shipment went out two days inside the window instead of a week late. Not a miracle. Just the difference between a system and a binder.
Pulling it together
Operational resilience in apparel isn't about predicting the specific failure. You won't. It's about building an architecture that holds up regardless of which failure arrives — capacity profiles so you know what your network can absorb, correlated-risk maps so you stop trusting fake redundancy, buffer math sized to real variability, and time-boxed runbooks so the first hours of a crisis produce decisions instead of chaos.
The brands that weather bad seasons aren't the ones with the thickest contingency binders. They're the ones who built these four layers to actually connect — where a risk map informs the buffer, the buffer funds the runbook, and the runbook respects the finance ceiling. Build the connections, keep the profiles current, and most disruptions stop being emergencies and start being things you simply manage.
The brands that weather bad seasons aren't the ones with the thickest contingency binders. They're the ones who built these four layers to actually connect — where a risk map informs the buffer, the buffer funds the runbook, and the runbook respects the finance ceiling. Build the connections, keep the profiles current, and most disruptions stop being emergencies and start being things you simply manage.
Ready to tailor your apparel operations?
Join 500+ fashion brands using GoTailo to accelerate product launches, reduce waste, and improve supplier collaboration.