

Most apparel brands don't actually design their supplier network. It accumulates. You start with one factory a friend recommended, add a second when the first got slammed during peak season, pick up a third because they could handle the technical knits the other two couldn't — and suddenly you're calling that a diversified sourcing base. It isn't. It's a pile of relationships with no shared logic underneath them.
The problem shows up the moment one node fails. A factory misses a ship date, a fabric mill goes dark for two weeks, a port backs up — and instead of the network absorbing the hit, the whole thing wobbles. Orders get reshuffled by hand, someone starts making frantic calls, and the "backup" factory turns out to have zero open capacity for the exact SKU you needed to move. The network wasn't built to fail gracefully. It was built to work only when everything works.
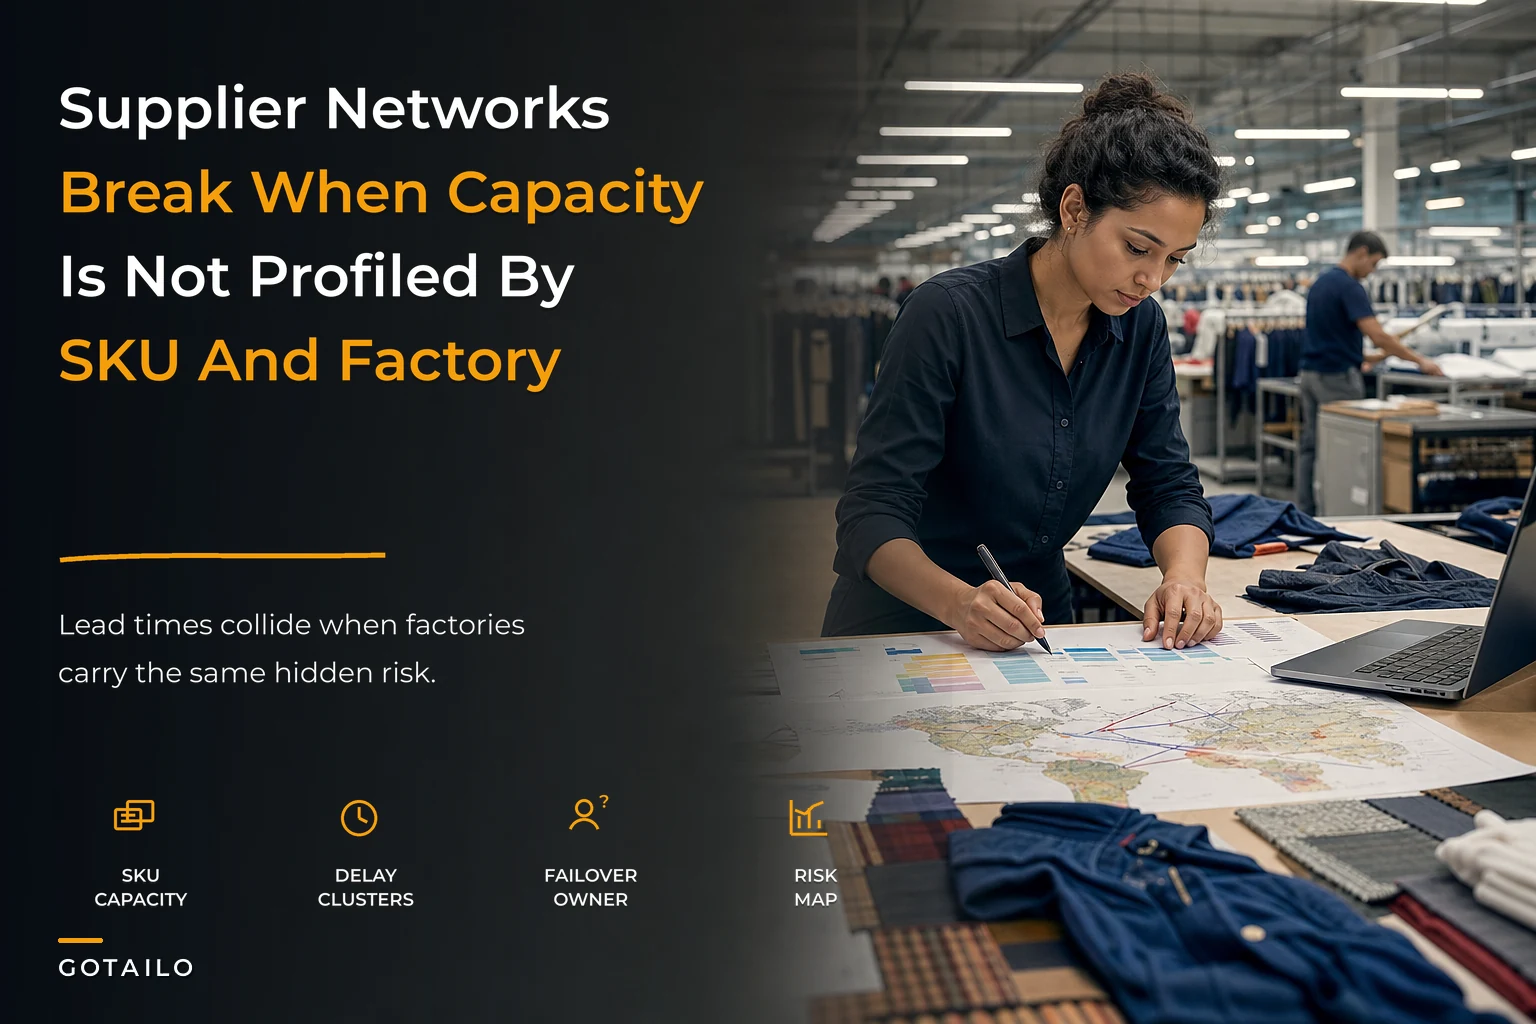
This piece is about the opposite approach: treating supplier network design as an actual engineering problem. Profiling capacity down to the SKU-and-factory level, mapping how lead times move together so you don't think you're diversified when you aren't, building failover playbooks you can run in an afternoon instead of a panicked week, and writing contracts that give you room to actually rebalance. There are worked examples and templates throughout.
Why networks that look diversified aren't
The pattern that quietly kills brands: on paper you have four suppliers, so you feel covered. But three of them source their poly-cotton blend from the same mill in the same region. When that mill has a problem — a power issue, a labor dispute, a raw material squeeze — three of your four "independent" suppliers get hit simultaneously. Your diversification was cosmetic.
Correlation is invisible until it bites. You don't map it, so you don't know it's there. Two factories in the same industrial cluster share the same trucking lanes, the same customs broker, sometimes the same embroidery subcontractor. When the shock is regional, your redundancy evaporates because your suppliers weren't actually independent — they were neighbors.
The second reason networks look stronger than they are: capacity gets treated as a single number. "This factory can do 20,000 units a month." Fine — but 20,000 units of what? A basic tee and a structured outerwear piece are not interchangeable on that factory's line. The real constraint is capacity per SKU type, per line configuration, and it shifts seasonally. When you plan against a blended average, you overbook the complex work and leave simple capacity idle, and neither shows up until you're staring at a delayed PO.
Step one: SKU-by-factory capacity profiling
The foundation of a network that survives pressure is knowing, honestly, what each factory can actually do for each product family — not in general, but in the specific configuration you'll actually order.
Eliminate delays in your fashion production cycle.
GoTailo helps you manage designs, orders, and inventory effortlessly, keeping production on schedule.
- Centralized order and inventory management
- Real-time supplier communication
- Integrated production scheduling
No credit card required
A useful profile captures more than headline units. For each factory and each SKU family you want to record:
-
Realistic monthly output at your typical order complexity (not their marketing number)
-
Setup/changeover cost — how much output they lose switching between your product types
-
Minimum viable run before unit economics fall apart
-
Quality yield for that specific product family (a factory great at wovens may run 8–10% defects on your technical knits)
-
Lead-time band — not a single number, a range with a realistic worst case
-
Ramp speed — how fast they can scale a new SKU from sample-approved to full run
A stripped-down profiling table for a single factory might look like this:
| SKU family | Realistic monthly units | Min run | Typical yield | Lead-time band (days) | Changeover penalty |
|---|---|---|---|---|---|
| Basic jersey tees | 18,000 | 1,500 | 97% | 28–36 | Low |
| Fleece hoodies | 9,000 | 1,000 | 94% | 35–48 | Medium |
| Structured outerwear | 3,500 | 600 | 89% | 50–70 | High |
| Technical knit tops | 4,000 | 800 | 91% | 42–58 | High |
The moment you build this for every factory, something clicks: you stop seeing "capacity" and start seeing a grid of matched capability. You'll notice that the factory you've been leaning on for everything is only genuinely strong in two families, and that your so-called backup can't touch your outerwear at any acceptable yield. That's the network's real shape — and it's usually a lot narrower than the org chart suggests.
One thing worth flagging: don't let factories self-report yields. Pull them from your own inspection and receiving data. If you've built a defect taxonomy and inspection routine, that's where the honest numbers live. If your supplier picture is still fuzzy on reliability, the groundwork in supplier scorecards and a tiered remediation loop feeds directly into these profiles — the scorecard tells you who, the capacity profile tells you for what and how much.
Step two: lead-time correlation maps
Once you have per-SKU capacity, the next question is whether your suppliers' lead times move together. This is the single most under-built piece of apparel network design, and it's the reason "backups" fail exactly when you need them.
A lead-time correlation map is simpler than it sounds. Take 12–24 months of actual receipt-vs-promised data per factory — your own records, not their claims. For each pair of factories, ask: when Factory A ran late, did Factory B also run late in the same window? If the answer is usually yes, those two are correlated. They're exposed to a shared cause, whether that's a common mill, a shared port, a regional holiday cluster, or the same monsoon season.
A typical example: a mid-size brand had four suppliers and felt comfortable. Mapping their delivery slippage over 18 months showed two of the four went late together in 7 out of 8 disruption windows. Their real independent supplier count wasn't four — it was closer to two and a half. That single realization reshaped their whole allocation strategy, because the "safe" second copy of a critical SKU was sitting at a correlated factory. The redundancy didn't exist.
You don't need statistical software for a first pass. A basic version:
-
List each factory's monthly late-days (average days behind promise).
-
Flag any month where a factory was more than one lead-time-band late as a "disruption month."
-
For each pair, count how often their disruption months overlap.
-
High overlap = correlated. Treat them as a single point of failure for planning purposes.
-
Diversify across low-overlap pairs — different regions, different mills, different logistics lanes.
The uncomfortable part: geographic distance alone doesn't guarantee independence, and same-region doesn't guarantee correlation. Two factories in the same city using different mills and different brokers can be less correlated than two factories on different continents that both depend on the same specialty trim supplier. Map the actual behavior, not the map.
For the raw diagnosis of why lead times drift in the first place, the data-first approach to unreliable vendor lead times pairs naturally with this — that work gives you the clean lead-time data this correlation map depends on.
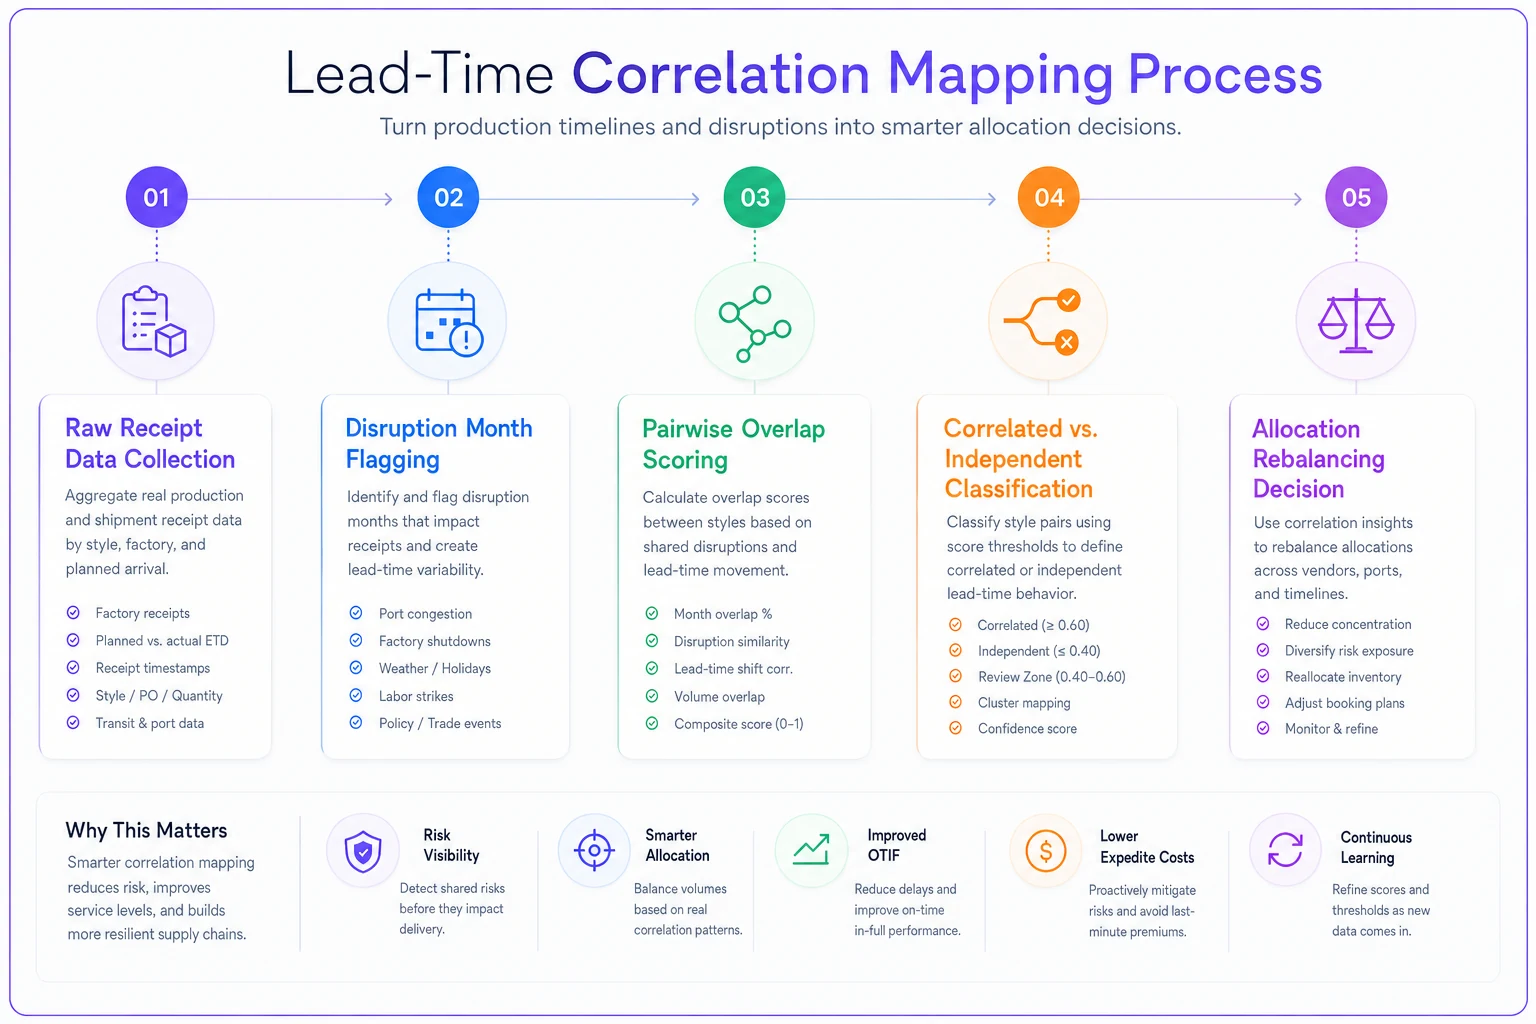
The diagram above sketches the workflow and helps teams align on where the disruption flags and overlap scores come from.
Step three: tactical failover playbooks
A failover playbook is a pre-decided answer to "a node just went down — what do we move, where, and how fast?" The whole point is to make the decision before the pressure hits, because decisions made mid-crisis are almost always slower and worse.
For each critical SKU — start with the top 20% that drive most of your revenue — a failover entry should specify:
-
Primary factory and its current committed load
-
Failover factory — chosen from your low-correlation set, with confirmed capability in that SKU family
-
Reserved swing capacity — units you've pre-negotiated to move on short notice
-
Trigger — the specific signal that activates the failover (missed WIP milestone, mill confirmation lapse, X days of silence)
-
Cost delta — what the switch costs per unit, known in advance
-
Time cost — added lead-time days for the failover route
A worked rebalancing example. A brand's core hoodie program ran 9,000 units/month at Factory A. Factory A hit a labor stoppage in week two of a run, putting the month's output at risk. Because the playbook already existed:
-
The trigger fired when A missed its cutting milestone by more than 4 days.
-
5,000 units stayed at A, with partial recovery expected.
-
3,000 units shifted to Factory C — chosen earlier precisely because its disruption months rarely overlapped with A's.
-
1,000 units were dropped from the run and rescheduled, because C's changeover penalty made the last thousand uneconomical to rush.
-
Cost delta was known upfront
roughly +11% per unit on the moved 3,000, plus about 9 extra transit days. Painful, but planned painful.
Total time from trigger to reallocated POs: under two days. A year earlier — same brand, no playbook — the same call took nine days and cost most of the season window. The difference wasn't luck or a better factory. It was having decided in advance.
The mistake most teams make with failover is treating it as "just find whoever has room." Whoever has room this week is often a correlated supplier or one with terrible yield on that SKU family. Failover destinations need to be pre-qualified from your capacity profile and correlation map, not scavenged in the moment.
Step four: contract guardrails that make rebalancing legal
You can design a solid failover plan and still be unable to execute it because your contracts don't let you. This is where a lot of otherwise-sharp brands get stuck — they've committed 100% of a SKU's volume to one factory with rigid minimums and no flexibility clauses, so moving units mid-season means eating penalties or breaching terms.
Guardrails worth building into supplier agreements:
-
Flex bands — the right to shift order volume up or down within a range (say ±20%) without penalty, on defined notice.
-
Swing capacity reservations — a pre-agreed block of short-notice capacity at your failover factory, often paid for with a small retainer or a volume commitment elsewhere.
-
Performance triggers — contractual definitions of what counts as a miss, tied to the same WIP milestones in your playbook, and what rights that miss unlocks.
-
No-exclusivity on your own designs — so you can dual-source a SKU across two factories without one claiming lock-in.
-
Data access clauses — the right to WIP status and receiving data you need to feed your correlation map and triggers.
Contracts and playbooks have to be written together. A playbook that says "move 3,000 units to Factory C on 5 days' notice" is fiction if your contract with C has a 3-week lead commitment and no swing block. Design them as one system.
When this level of rigor actually makes sense — and when it doesn't
This isn't free. Profiling capacity, maintaining correlation maps, and negotiating flex clauses takes real time, so be honest about fit.
This makes sense when: you're running enough SKU volume that a single missed run costs real money, you have at least three suppliers to coordinate, and your seasons are tight enough that a nine-day scramble blows a launch. If a delayed PO means missing a retail window or a drop date, the payback is obvious.
This is overkill when: you're a small brand with one or two makers and low volume. At that stage, formal correlation maps are theater — your real move is a solid relationship and a known second maker, not a spreadsheet of failover triggers. Build the discipline, skip the apparatus.
Who should not do this yet: anyone whose underlying supplier data is still a mess. If you can't trust your own receiving and defect numbers, every profile and correlation map you build will be confidently wrong. Fix the data foundation first — capacity profiling on bad data is worse than no profiling, because it manufactures false confidence.
A short real scenario
A contemporary womenswear brand doing roughly $6M–$7M a year ran five factories and considered themselves well-diversified. Two seasons in a row they got burned when a "backup" factory couldn't take reallocated volume — same region, same overloaded weeks as the primary.
They built SKU-by-factory profiles over about six weeks using two years of their own receiving data, then mapped lead-time correlation. The map showed three of five factories moved together during disruptions. They re-qualified one genuinely independent supplier in a different region on a different mill, wrote a ±15% flex band and a 2,000-unit swing reservation into two contracts, and built failover entries for their top 30 SKUs.
The next disruption — a mill delay that would previously have cost them most of a season — cost them about 12 late days on a portion of the order and a single-digit percentage cost bump. Not painless. But the launch shipped, which the prior version of this brand couldn't have said.
The change wasn't a better factory. It was a network that knew its own shape and had already decided what to do when a piece of it failed.
Pulling it together
A supplier network isn't the number of factories you can name — it's how the whole thing behaves when one part fails. Capacity profiling tells you what each node can genuinely do. Correlation maps tell you which nodes are secretly the same risk. Failover playbooks turn a crisis decision into a pre-made one. Contract guardrails make sure the plan you designed is actually executable rather than a document you're not allowed to act on.
Keeping all of this current — profiles that drift as factories change, correlation maps that need fresh receiving data, triggers wired to live WIP status — is genuinely more than a spreadsheet wants to hold once you're past a handful of SKUs. This is where an operational platform that centralizes supplier data, tracks performance signals, and surfaces triggers automatically earns its place: not to make the decisions for you, but to keep the profiling and correlation work from going stale the moment you build it. The judgment stays yours. The bookkeeping that makes the judgment possible is what you want off your plate.
Start narrow. Profile your top revenue SKUs across the factories you already use, map correlation on the data you already have, and write one real failover entry. A network that survives pressure isn't built in a quarter — but the difference between a two-day reallocation and a nine-day scramble usually comes down to work you did before anything broke.
Ready to tailor your apparel operations?
Join 500+ fashion brands using GoTailo to accelerate product launches, reduce waste, and improve supplier collaboration.