


Most apparel brands treat returns as a cost center to be minimized and forgotten. The garment comes back, someone glances at it, it either goes back on the shelf or gets tossed in a "deal with later" bin, and the finance team writes off whatever they can't reconcile at quarter close. That's not a returns process. That's a slow leak with no gauge on it.
The gap between brands that recover 60–70% of returned inventory value and those that recover under 30% almost never comes down to the quality of the returns themselves. It comes down to whether the whole chain — from the moment a box hits the dock to the moment cash or credit lands back in the ledger — actually behaves like a connected system. When triage, refurbishment routing, resale channels, and accounting flows don't talk to each other, value evaporates in the handoffs.
This is the part of reverse logistics apparel recovered value work that gets ignored: the money isn't lost at any single station. It's lost in the seams between stations. So this article walks through the operating model as a whole — where it breaks, how the parts connect, and what changes when you're processing 200 returns a month versus 2,000.
The core problem: returns are a multi-owner process with no single owner
A single returned jacket touches warehouse ops, quality, merchandising, e-commerce, finance, and sometimes the original factory. Each of those functions has its own priorities, its own system, and its own definition of "done." Warehouse wants the bin cleared. Merchandising wants full-price sell-through protected. Finance wants a clean reconciliation. Quality wants defects logged. None of them owns the garment end-to-end.
That's why returns pile up. Not because people are lazy — because the item enters a zone where accountability is genuinely ambiguous. In real operations, this usually shows up when a return arrives without a disposition decision already attached to it. The box shows up, and now someone has to think about each unit. Thinking is expensive at volume.
The fix isn't more hustle. It's a model where the disposition decision is made fast, routed automatically, and reconciled against a financial expectation that was set the moment the return was authorized. Everything downstream flows from getting that first decision right and making it stick.
Stage one: triage that produces a decision, not a pile
Triage is where recovered value is won or lost, and most teams under-invest in it because it feels like low-skill work. It isn't. A good triage station converts a physical garment into a disposition decision with a financial consequence attached, in under two minutes per unit.
Eliminate delays in your fashion production cycle.
GoTailo helps you manage designs, orders, and inventory effortlessly, keeping production on schedule.
- Centralized order and inventory management
- Real-time supplier communication
- Integrated production scheduling
No credit card required
The mistake that comes up constantly: triage that only sorts by condition ("good," "damaged," "trash") without connecting condition to the best recovery channel. A lightly worn dress in a discontinued colorway isn't a "restock" just because it's clean — the right channel might be an outlet or a marketplace liquidation, because putting it back on the primary site displaces full-price inventory and confuses the size curve.
If you've already built a condition-based sorting system, this article on a triage matrix to repair, refurbish or restock faster covers the physical sorting logic in more depth. What we're adding here is the layer above it: tying each triage outcome to a routing path and an expected recovery value, so the decision carries dollars, not just categories.
| Condition | Sellability window | Refurb cost estimate | Disposition | Target recovery |
|---|---|---|---|---|
| New, tags on, current season | In-season | $0 | Restock — primary channel | 90–100% of retail |
| New, no tags, current season | In-season | $1–3 (re-tag, press) | Restock — primary channel | 85–95% |
| Light wear, current season | In-season | $4–8 (clean, minor repair) | Refurb → primary or outlet | 60–80% |
| Light wear, past season | Off-season | $4–8 | Refurb → outlet / marketplace | 35–55% |
| Repairable defect, any season | Any | $8–20 | Refurb → secondary channel | 30–50% |
| Non-repairable, salvageable materials | N/A | N/A | Recycle / material recovery | 5–15% |
| Non-repairable, non-salvageable | N/A | N/A | Responsible disposal | 0% (cost only) |
The number that matters most in this table isn't the target recovery — it's the refurb cost estimate. A refurbishment routing decision that ignores its own cost is how brands end up spending $14 in labor and materials to recover a garment worth $22 on a liquidation channel. That's technically "recovered value," but it's a rounding error, and it clogged the refurb queue for something that should have gone straight to bulk liquidation.
The disposition matrix is a starting point, not a permanent document. Product mix, return reasons, and channel economics shift enough that revisiting it quarterly — even just a 20-minute review — is worth the time.
Revisiting it quarterly — even just a 20-minute review — is worth the time.
The disposition matrix is a starting point, not a permanent document. Product mix, return reasons, and channel economics shift enough that revisiting it quarterly — even just a 20-minute review — is worth the time.
Stage two: refurbishment routing without the bottleneck
Once triage assigns a disposition, refurbishment becomes the most common chokepoint — because it's the only stage that requires skilled hands and physical time. Everything else is decisions and data. Refurb is actual work.
The pattern that breaks at scale: a single refurb queue that treats a button replacement and a full re-dye the same way. At 200 returns a month you can get away with one queue and one skilled person triaging on the fly. At 2,000 a month, that person becomes the entire system's bottleneck, and returns age out of their sellability window while sitting in a repair basket.
The better structure is to split refurb by effort tier the moment triage tags it:
-
Tier 1 — cosmetic (under 5 min) pressing, lint removal, re-tagging, repackaging. Batch these. One person can clear 60–80 units a day.
-
Tier 2 — minor repair (5–20 min) button/snap replacement, small seam repairs, spot cleaning. Requires a sewing machine and a defined skill level.
-
Tier 3 — major repair (20+ min or specialized) re-dye, panel replacement, hardware swaps. Route these to a dedicated station or an outside vendor, and set a hard rule: if Tier 3 cost exceeds the expected recovery on the best available channel, it doesn't get repaired — it drops to material recovery.
The insight most brands miss is that refurb capacity should be planned against return volume the same way you plan production against a build schedule. If the return rate runs 18–22% on a given category and the peak drop lands in March, the refurb team's March capacity isn't a guess — it's forecastable. Teams that skip this step end up hiring reactively, quality suffers, and the recovery window gets missed.
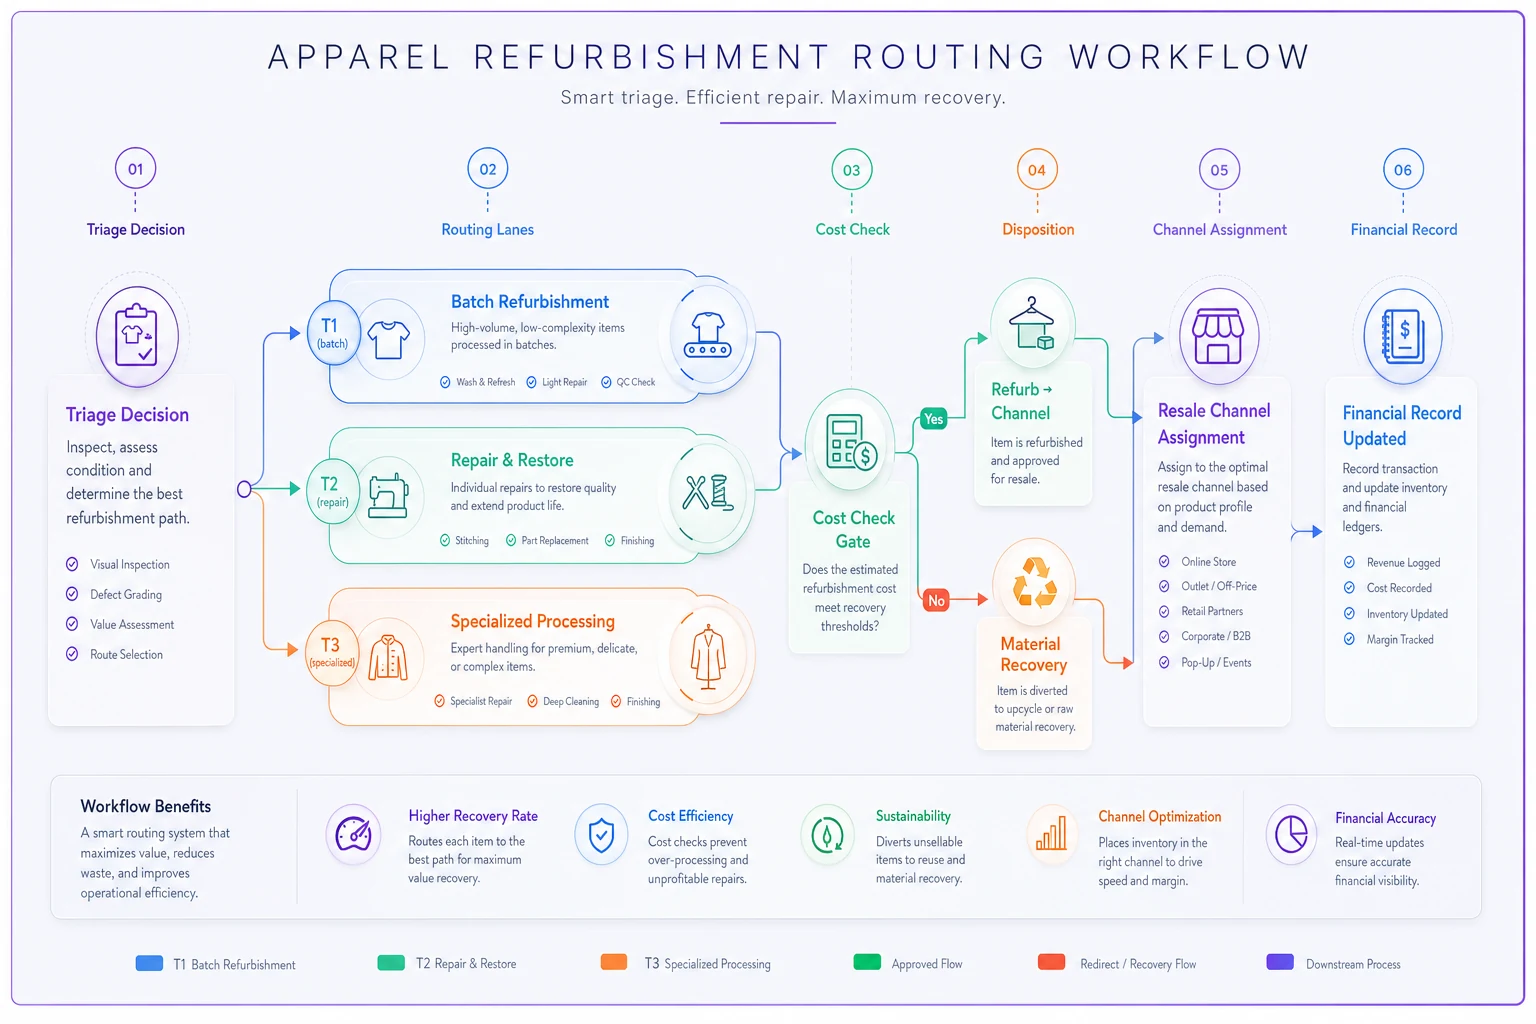
The flow above illustrates the routing from triage to the three refurb tiers, the cost check on specialized work, and the downstream assignment to resale channels and financial records.
Tier 1 work is often undervalued operationally — it's unglamorous, but it's the highest-margin refurb you run. Sixty units cleared in a day at near-zero cost each, restocked at 85–95% of retail, moves the blended recovery number faster than anything happening in the Tier 3 queue.
Stage three: resale channel governance
This is the stage that quietly determines whether you're building or destroying brand equity. Every recovered unit has to land somewhere, and channel choice isn't just a margin decision — it's a governance decision.
A typical failure: refurbished current-season product gets dumped onto a discount marketplace because that's the path of least resistance for the warehouse. Six weeks later, merchandising notices the marketplace is undercutting the brand's own primary site on live SKUs, cannibalizing full-price demand. Now returns aren't just a cost — they're actively suppressing new-product revenue.
Channel governance means writing down, in advance, which dispositions are allowed to touch which channels:
-
Primary site / stores only new or Tier-1-refurbed, current-season, full-size-curve units. Never a live SKU below a defined stock threshold you're trying to protect.
-
Owned outlet / clearance current and recent-season refurb, priced to avoid competing with primary on active SKUs.
-
Third-party marketplaces past-season and secondary-condition units, with a rule that no active primary SKU appears here while it's still selling at full price.
-
Bulk liquidation aged inventory, Tier 3 units below repair economics, end-of-life material.
The governance layer needs an owner in merchandising, not warehouse. The warehouse executes the routing; merchandising sets the rules because they're the ones accountable for full-price sell-through. When the same person owns both, you get short-term recovery at the cost of long-term margin. Keeping the decision rights split — warehouse moves, merch governs — is one of the cleaner separations of duty in the whole model.
What makes this break in practice is usually staffing: a small brand where the warehouse manager is also the channel manager is also occasionally the person doing the triage. The governance logic still applies, it just needs to be written down explicitly so whoever's wearing the most hats knows which hat they're wearing for each decision.
Where the accounting actually breaks
Nobody enjoys this part, and almost everybody gets it wrong. The physical flow can be flawless and you'll still lose money in reconciliation if the financial flow isn't wired to match it.
The root issue: a return generates several distinct financial events that hit different ledgers at different times. There's the customer refund (AP-adjacent, or a credit), the inventory revaluation as the unit moves from full-price to a disposition value, the refurb cost (labor + materials, often expensed separately), and eventually the resale revenue when the recovered unit sells through a secondary channel. If these aren't linked to the same return record, finance can't tell you what any individual return actually netted.
Across a lot of brands, returns get reconciled in aggregate — "we processed $84k of returns this quarter and recovered about $41k" — with no ability to drill into which categories, conditions, or channels drove the recovery rate. That aggregate number is useless for improving the system, because it hides the two or three disposition paths that are quietly losing money.
A worked reconciliation routine for a single return record should tie together:
-
RMA authorization value — the original sale value being returned (this sets the expected liability).
-
Refund/credit issued — actual AP outflow or store credit liability created.
-
Inventory disposition value — the revalued asset once triage assigns a disposition (this is the write-down).
-
Refurb cost applied — Tier 1/2/3 labor and materials booked against that unit or batch.
-
Resale proceeds — revenue recognized when the recovered unit finally sells, matched back to the RMA.
Net recovered value = resale proceeds − (refund/credit + refurb cost + handling). Run that per disposition path, not just in aggregate, and the losing paths reveal themselves immediately.
A quick example with numbers
Take a mid-size brand processing roughly 1,400 returns a month, average original unit value around $58. Before they connected the financials to the physical flow, finance reconciled quarterly and reported a recovery rate hovering around 34%. Nobody could say why.
Once they started tracking net recovery per disposition path, the picture changed. Tier 1 restocks were recovering close to 90% — solid. But the Tier 3 refurb path was running roughly break-even to slightly negative once labor was fully loaded, and it was consuming most of the skilled refurb hours. Meanwhile a large chunk of past-season product was being marked down too aggressively on the primary outlet instead of moving to a marketplace that would've cleared it at a similar net without depressing the outlet's average selling price.
Rerouting Tier 3 borderline units to material recovery and shifting the past-season flow to the right channel moved blended recovery from around 34% to somewhere in the 48–52% range over about two quarters. On roughly $80k of monthly returned value, that's an additional recovery of somewhere near $11k–$14k a month — money that was previously leaking through misrouted units and untracked refurb cost.
Worth noting: the recovery-rate improvement here is downstream of the same margin discipline you'd apply upstream in production. If your costing already accounts for rework and freight the way this breakdown of costing templates that include sampling, rework and freight lays out, the refurb cost side of this reconciliation slots in cleanly rather than showing up as a mystery line item.
KPIs that actually drive the system
Most returns dashboards track return rate and stop there. Return rate is a demand-side and product-fit signal — useful, but it tells you nothing about how well the recovery engine runs. The KPIs that matter for this operating model are different:
-
Blended recovered-value percentage — net recovery across all dispositions, tracked monthly.
-
Recovery % by disposition path — the one that exposes losing routes.
-
Triage cycle time — hours from dock receipt to disposition decision. If this creeps past 48 hours, current-season units start missing their window.
-
Refurb queue age — oldest unit in each tier. A growing Tier 2/3 age is your early warning of a capacity problem.
-
Sellability-window hit rate — % of current-season returns that got back to a sellable state before the season closed.
-
Reconciliation lag — days between resale proceeds and their match back to the originating RMA.
Triage cycle time and sellability-window hit rate are leading indicators; recovered-value percentage is a lagging one. If you only watch the lagging number, you find out you missed the window a quarter after it happened. Watch the leading ones and you can intervene while the season's still open.
These KPIs are also the conversation between warehouse ops and merchandising — triage cycle time is a warehouse number, but if it's drifting, merchandising feels it in the sellability-window hit rate. Keeping both teams looking at the same dashboard, even informally, closes that accountability gap faster than any process redesign.
Where a connected system helps — and where it doesn't
Running this on spreadsheets works up to a point. A few hundred returns a month with a couple of channels, a disciplined team can hold it together with a shared sheet and a weekly reconciliation huddle. Once you cross into thousands of units, multiple refurb tiers, and three-plus resale channels, the manual model stops holding because the handoffs multiply faster than the volume does.
This is where a workflow platform that links the disposition decision to the routing, the refurb cost capture, and the AR/AP reconciliation earns its place — not because it's clever, but because it removes the re-keying between systems that's the actual source of reconciliation lag. When triage tags a unit, the routing, the expected recovery value, and the accounting expectation should all populate off that single decision. AI-assisted disposition suggestions can speed the triage call itself by flagging condition and season against the matrix, but the real value is that the financial record follows the physical unit automatically instead of being reconstructed at quarter close.
When this level of system makes sense: you're above ~1,000 returns a month, you sell across multiple channels, and finance can't currently tell you net recovery by disposition path.
When it's overkill: you're processing under a couple hundred returns a month on a single channel, and the team can reconcile weekly by hand without falling behind. Don't build a governance layer for a problem you don't have yet — you'll spend more on the structure than you lose to the leak.
Who should not do this: brands with a return rate under a few percent and low unit values. If returns are small in both count and value, the labor to run a full recovery model can cost more than the value you'd recover. For those, a simple restock-or-liquidate rule is genuinely the right answer.
Bringing it together
The brands that turn returns into cash aren't the ones with the best refurb technicians or the cheapest liquidation channel. They're the ones who treat the whole path — triage, routing, resale governance, and reconciliation — as one accountable system where a decision made at the dock carries a dollar figure all the way to the ledger.
The leaks are almost always in the seams: a triage decision that ignores refurb economics, a refurb queue with no capacity plan, a marketplace cannibalizing full-price SKUs, a finance team reconciling in aggregate and never seeing which path loses money. Close those seams, track recovery by disposition path instead of one blended number, and the same volume of returns that used to feel like a cost center starts behaving like a recovery channel with a measurable rate you can actually improve quarter over quarter.
The leaks are almost always in the seams: a triage decision that ignores refurb economics, a refurb queue with no capacity plan, a marketplace cannibalizing full-price SKUs, a finance team reconciling in aggregate and never seeing which path loses money. Close those seams, track recovery by disposition path instead of one blended number, and the same volume of returns that used to feel like a cost center starts behaving like a recovery channel with a measurable rate you can actually improve quarter over quarter.
Ready to tailor your apparel operations?
Join 500+ fashion brands using GoTailo to accelerate product launches, reduce waste, and improve supplier collaboration.