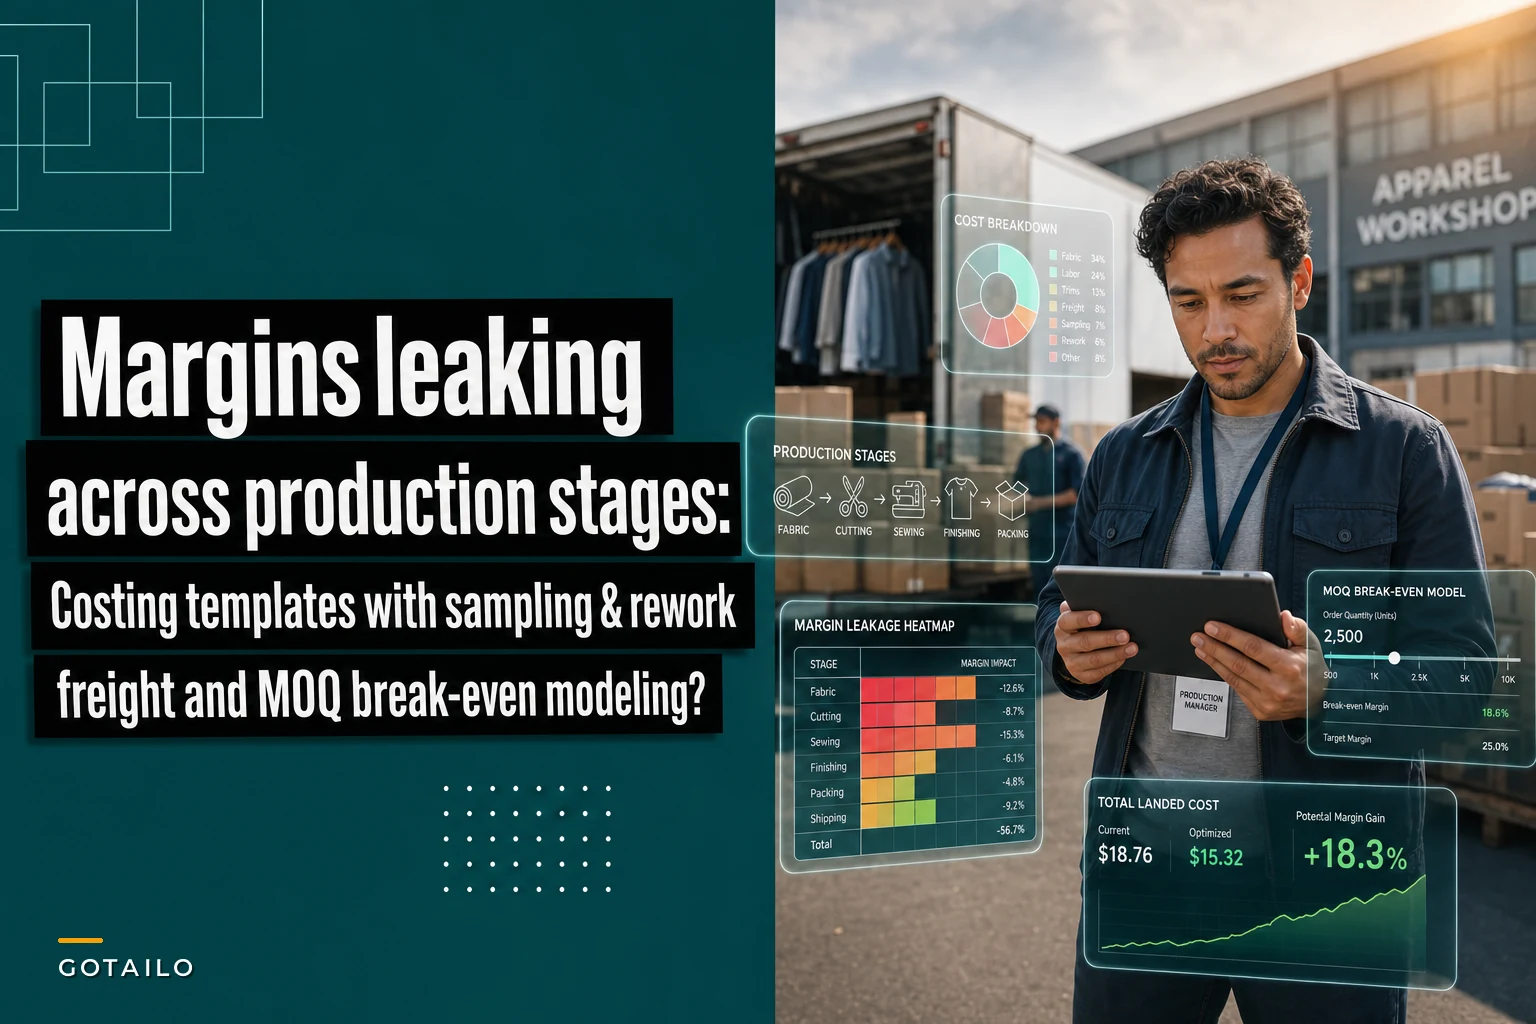

That sinking feeling when your supposedly 40% margin hoodie line delivers 18% after everything's shipped? The culprit usually isn't your base costing—it's all the bleeding between initial quote and customer delivery.
Most apparel costing models stop at first-cost calculations. Fabric, trim, labor, overhead. Maybe they'll add a freight estimate. But they completely miss the operational reality where samples eat fabric, quality failures trigger rework, and expedited shipping destroys carefully planned margins.
I started building stage-by-stage costing worksheets that capture what really happens during production after watching countless brands discover their actual costs only during post-season analysis. Not the ideal scenario—the actual scenario.
Why traditional costing breaks down in apparel production
Standard apparel costing follows a simple formula: materials + labor + overhead + markup = wholesale price. Clean, logical, and completely divorced from operational reality.
Your sampling process burns through 3-7% of your fabric allocation before production even starts. SMS (strike-off, mockup, salesman) samples, size sets, photo samples—each iteration consumes materials that rarely get factored into unit costs. A brand ordering 5,000 units might use fabric for 5,350 units when you include sampling waste.
Quality control isn't just inspection—it's a cost multiplier. When inline inspection catches issues at 15% completion, you're not just fixing defects. You're potentially scrapping materials, paying for rework labor, and dealing with schedule compression that forces air freight. One production manager showed me their actuals: a $12 FOB tee became $16.80 delivered after QC-triggered interventions.
These costs don't distribute evenly either. Your first 500 units might cost $24 each when you amortize sampling and setup. Units 501-2000 drop to $18. Units beyond 2000 approach your target $15. But if you're testing market with small runs, you never reach efficient scale.
The compound effect nobody discusses
Each production hiccup creates ripple effects. A fabric delay doesn't just push timeline—it compresses QC windows, forces weekend labor rates, and triggers express shipping. That single delay can add $2-4 per unit across indirect costs that never show up in your original BOM.
Building a stage-gate costing model
Production happens in stages, and costs accumulate differently at each gate.
Eliminate delays in your fashion production cycle.
GoTailo helps you manage designs, orders, and inventory effortlessly, keeping production on schedule.
- Centralized order and inventory management
- Real-time supplier communication
- Integrated production scheduling
No credit card required
Stage 1: Development & Sampling
Track every prototype iteration. A typical development cycle for a new style runs something like:
-
Initial prototype
$180-250 in materials and labor
-
Fit adjustments (2-3 rounds)
$120-180 per round
-
SMS samples (6-12 pieces)
$15-25 per unit
-
Size run (full size range)
$18-30 per unit
-
Photo samples
$20-35 per unit
For a 3,000-unit order, these sampling costs add $0.40-0.85 per production unit. Most brands never allocate this back to unit economics.
Stage 2: Production Setup
-
Pattern grading
$300-500 per style
-
Marker development
$150-250
-
Cutting setup
$200-400
-
First article inspection
$250-350
At 500 units, these add $2-3 per piece. At 5,000 units, it's $0.20-0.30.
Stage 3: Manufacturing with Reality Factors
-
Cutting waste allowance
3-5% for stable fabrics, 5-8% for stretchy materials
-
QC failure rate
2-4% for experienced factories, 4-8% for new partners
-
Rework percentage
1-3% of production typically needs intervention
-
Size ratio adjustments
XS and XXL often consume different material amounts than your base medium calculation
Stage 4: Logistics & Duties
-
Sea freight (45 days)
$0.45-0.75 per unit
-
Air freight (7 days)
$4.50-7.50 per unit
-
Mixed mode (sea + air for partial)
varies by split
Then add duties (depends on classification), inland freight, and warehouse handling. A jacket with $22 FOB can hit $31 landed cost with standard shipping, or $38 if you air freight to hit retail dates.
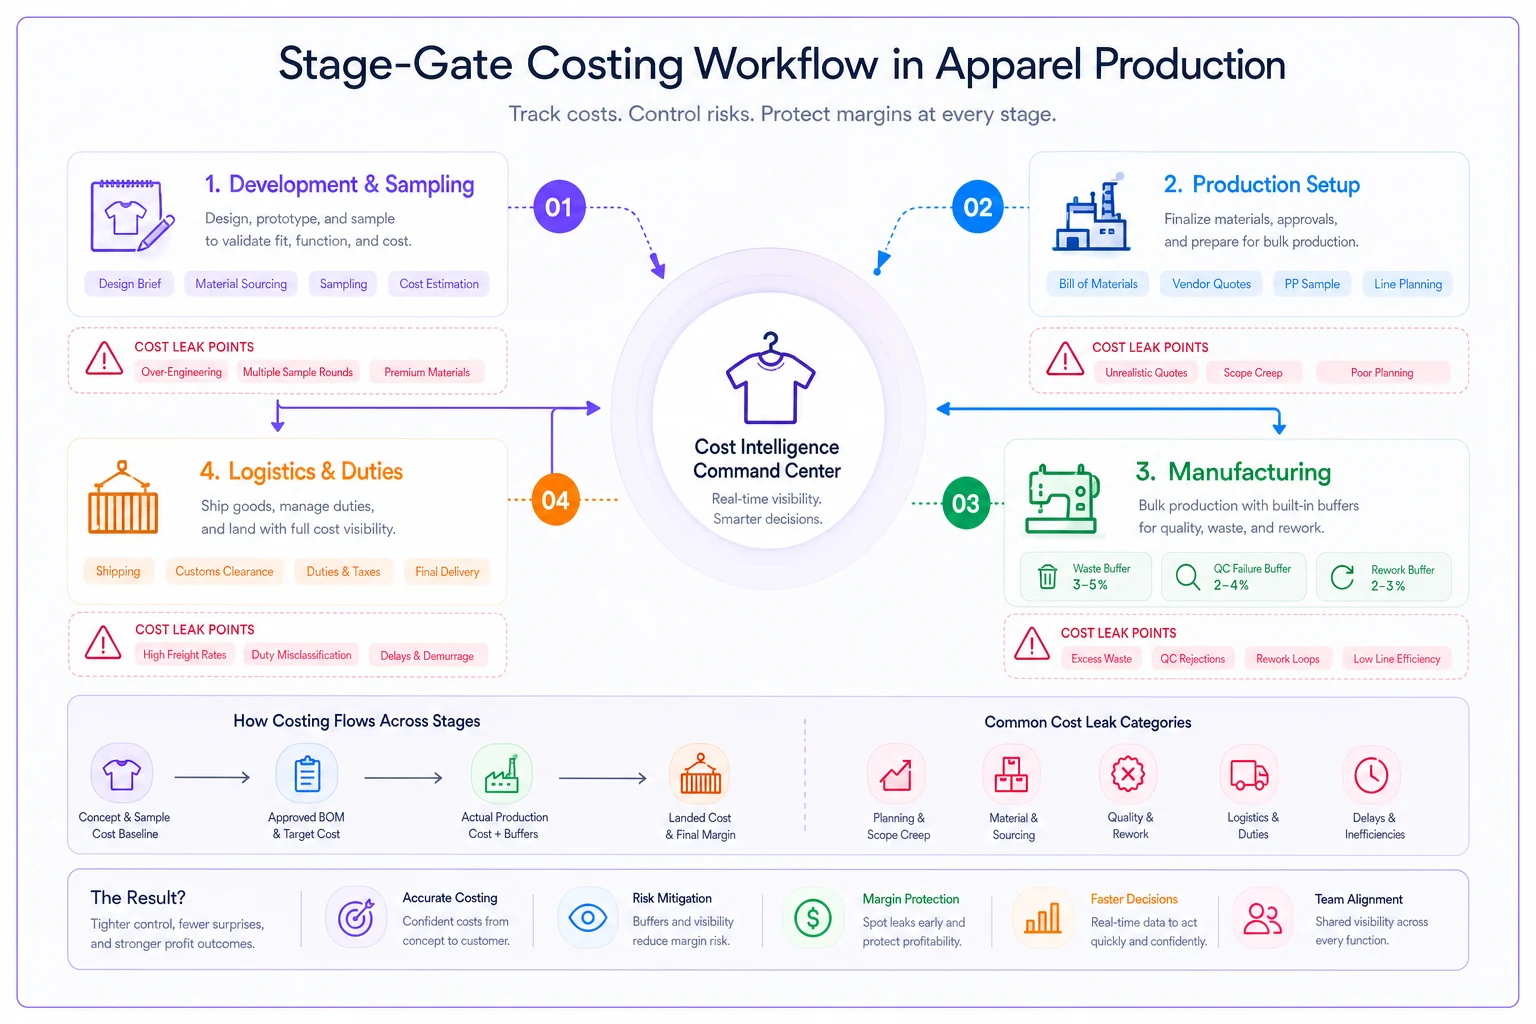
A simple visual of the stage-gate flow and common cost leak points.
The worksheet structure that actually works
Stop using single-tab Excel files. Multi-sheet structure that captures real production economics:
Sheet 1: Base Cost Build
Standard BOM costing with consumption rates, but add columns for:
-
Minimum order quantities per material
-
Waste percentages by material type
-
Setup charges that amortize differently
Sheet 2: Sampling Matrix
| Sample Type | Quantity | Material Cost | Labor Hours | Total Cost | Per Unit Allocation |
|---|---|---|---|---|---|
| Initial Proto | 1 | $85 | 4.5 | $180 | $0.06 |
| Fit Revision | 2 | $60 | 3.0 | $240 | $0.08 |
| SMS Set | 8 | $20 | 1.5 | $280 | $0.09 |
Sheet 3: Production Scenarios
Build three scenarios minimum:
-
Best case
Everything goes right, sea freight, no rework
-
Likely case
Historical average defect rates, some air freight
-
Stress case
Quality issues, full air freight, maximum rework
Each scenario shows different unit economics. The spread often surprises people—I've seen $8 swings between best and stress cases.
Sheet 4: MOQ Breakeven Analysis
Map quantity to unit cost including all factors:
-
500 units
-
1,000 units
-
2,500 units
-
5,000 units
-
10,000 units
Include a reverse calculator: "To hit $X target cost, minimum order is Y units"
Sheet 5: Margin Impact Dashboard
-
Target margin at first cost
-
After sampling allocation
-
After QC/rework reserve
-
After logistics
-
Actual delivered margin
Track sampling iterations per style in a dedicated column so you can amortize costs accurately.
Visual breakdown showing margin erosion at each stage.
Common costing blind spots that kill margins
The small-batch trap
Brands testing new styles often order 300-500 units thinking they're being conservative. But when sampling costs $2,000 and setup runs $1,500, those 400 units carry $8.75 in pre-production costs alone. Add expedited shipping because small batches always run late, and your $15 target cost becomes $26 delivered.
Fabric minimum devastation
Your shirt needs 1.4 yards of fabric per unit. You're ordering 800 units, so 1,120 yards needed. But the fabric minimum is 1,500 yards. Those extra 380 yards either become dead stock or force you to over-produce. Either way, your actual fabric cost per unit just jumped 34%.
The rework time bomb
Factory quotes assume clean production. Reality: 2-5% of goods need rework. But rework isn't just labor cost. It includes production line disruption, schedule slippage, potential air freight triggers, quality team overtime, and possible material replacement. One brand's data: their average rework incident added $3.20 per unit across the entire production run when you factor in all impacts.
Duty classification optimization
Switching your synthetic-blend jacket classification from 6201.93 to 6201.13 might drop duty rates from 27% to 16%. Most brands just accept whatever classification their freight forwarder suggests. On a $30 FOB jacket, that's $3.30 per unit in unnecessary costs.
Real scenario: Athletic apparel startup's costing evolution
Small activewear brand, launching with five styles. Initial costing showed healthy 55% margins at $35 wholesale price point.
Production Flow Analysis - First Run: Development → Sampling → Production → QC → Logistics → Delivery ↓ ↓ ↓ ↓ ↓ ↓ $2,500 $6,000 $35,250 +$4,200 +$8,500 $56,450 (setup) (samples) (mfg) (rework) (air frt) (total)
First production run reality:
-
Moisture-wicking fabric minimums forced 40% overproduction
-
Sample iterations burned through $8,500 before production
-
QC caught print registration issues on 300 units (12% of run)
-
Rework delayed shipping by two weeks, triggering partial air freight
-
Actual delivered cost
$19.40 per unit (versus $14.75 projected)
-
Real margin
31%
After implementing stage-gate costing:
-
Identified fabric pooling opportunity across styles
-
Reduced sampling iterations with better tech pack detail
-
Built 15% buffer into timeline to avoid air freight
-
Negotiated pre-production sampling as separate budget line
-
Second run delivered cost
$16.20 per unit
-
Margin recovery
42%
They stopped pretending production was linear and started costing for how apparel manufacturing actually works.
MOQ mathematics most brands get wrong
Your factory quotes 500-piece MOQ. Seems reasonable for testing market. But here's the full picture: Fabric supplier requires 1,000-yard minimum. Your consumption is 1.5 yards per unit. So 500 units need 750 yards, but you're buying 1,000. That excess 250 yards either becomes waste or forces you to produce 667 units. Now you're over MOQ, sitting on excess inventory.
Trim minimums create similar chaos. Zippers might have 500-piece minimums, but labels come in 3,000-piece rolls. Buttons are sold by gross (144 pieces). Suddenly your 500-unit order has enough trim for disparate quantities—some for 500, some for 3,000.
The worksheet solution: Build a "True MOQ Calculator" that finds the least common multiple across all components. Often the real economical minimum is 2-3x the factory's stated MOQ.
Scenario modeling for margin protection
Static costing assumes perfect execution. Scenario modeling assumes Murphy's Law.
Build three models minimum:
Optimistic (20% probability)
-
First-pass quality
98%
-
On-time delivery via sea freight
-
No sampling overruns
-
Standard fabric consumption
Realistic (60% probability)
-
First-pass quality
94%
-
20% requires air freight for date compliance
-
15% sampling overrun
-
3% excess fabric consumption from spreading issues
Pessimistic (20% probability)
-
First-pass quality
88%
-
60% requires air freight
-
40% sampling overrun
-
7% excess fabric consumption
-
Rework delays trigger penalty charges
Weight these scenarios: (Optimistic × 0.2) + (Realistic × 0.6) + (Pessimistic × 0.2) = Expected cost
This weighted cost becomes your real planning number. Usually 15-25% higher than optimistic scenarios, but at least you're planning for reality.
The automation opportunity in costing
Modern apparel costing models start leveraging operational software. Not replacing spreadsheets entirely, but connecting them to real production data.
When your costing worksheets pull actual defect rates from QC reports, actual fabric consumption from cutting records, and actual shipping splits from logistics data, the models become living documents instead of one-time estimates.
Brands getting this right connect their costing models to their production tracking systems. Each completed order feeds back actual costs by stage, improving future estimates. Pattern recognition across multiple seasons reveals which factories consistently trigger rework, which fabric types waste more in cutting, which styles require more sampling iterations.
This isn't about complex AI prediction—it's about replacing guesswork with historical patterns. When your costing template knows your factory's actual first-pass quality rate is 92.3% (not the 98% they claim), you price accordingly.
AI-powered operational software takes this further by automatically updating cost assumptions as production data flows in. Instead of manual post-season analysis, the system continuously refines costing accuracy based on real performance metrics.
Making it actionable
Start with this progression:
First, map your actual costs from last season. Take three completed styles and rebuild their economics with every cost included—sampling, rework, freight switches, everything. The gap between projected and actual will justify the effort for better modeling.
Next, build style-specific templates. Don't try creating one universal costing sheet. T-shirts, hoodies, and jackets have different complexity levels, different quality risk profiles, different freight densities.
Then add scenario toggles. Simple dropdown menus that switch between freight modes, quality scenarios, and order quantities. Seeing costs shift in real-time during negotiations changes how you approach orders.
Finally, create feedback loops. After each production run, update your model assumptions with actual data. Your templates become smarter each season.
Beyond the spreadsheet
The most sophisticated brands have moved beyond static worksheets to dynamic costing systems that update as production progresses. When cutting reports show 6% waste instead of planned 4%, the model adjusts remaining unit costs immediately. When inline inspection suggests rework needs, the system calculates freight impact before it becomes critical.
But you don't need complex systems to start. Even a well-structured Google Sheet that captures stage-gate costs beats traditional linear costing. The key is acknowledging that apparel production isn't a straight line—it's a series of stages where costs compound and margins erode unless actively managed.
Brands protecting their margins in today's environment aren't the ones with perfect execution. They're the ones who price for reality, model scenarios, and track actual costs religiously. Their costing worksheets don't promise fantasy margins—they reveal true economics early enough to adjust strategy.
Templates to get you started
Rather than starting from scratch, here's what an effective costing template structure looks like:
The Sampling Cost Allocator
-
Tracks every sample type and quantity
-
Calculates material and labor per sample
-
Amortizes total sampling cost across production units
-
Shows per-unit impact at different order quantities
The Scenario Comparison Matrix
-
Three scenarios (optimistic/realistic/pessimistic)
-
Toggles for quality rates, freight modes, rework percentages
-
Weighted average calculation
-
Visual margin impact display
The MOQ Optimization Calculator
-
Component-level minimum tracking
-
Least common multiple finder
-
Excess inventory cost calculator
-
Break-even quantity identifier
The Stage-Gate Margin Tracker
-
Margin at each production stage
-
Cumulative cost build
-
Variance from target flagging
-
Historical accuracy scoring
Start with one style, one season. Build the full cost picture including every sample, every quality issue, every freight adjustment. Once you see the gaps in your current costing, you'll never go back to simple first-cost calculations.
The goal isn't perfection—it's visibility. When you can see where margins leak, you can plug the holes. When you model scenarios, you can price for reality. When you track actuals against projections, your costing gets smarter every season.
Building this costing discipline isn't just about better spreadsheets. It's about understanding that every production decision from sampling to shipping affects unit economics. Once you start modeling these impacts, you stop being surprised by margin erosion and start actively preventing it.
Brands protecting their margins in today's environment aren't the ones with perfect execution. They're the ones who price for reality, model scenarios, and track actual costs religiously.
Ready to tailor your apparel operations?
Join 500+ fashion brands using GoTailo to accelerate product launches, reduce waste, and improve supplier collaboration.