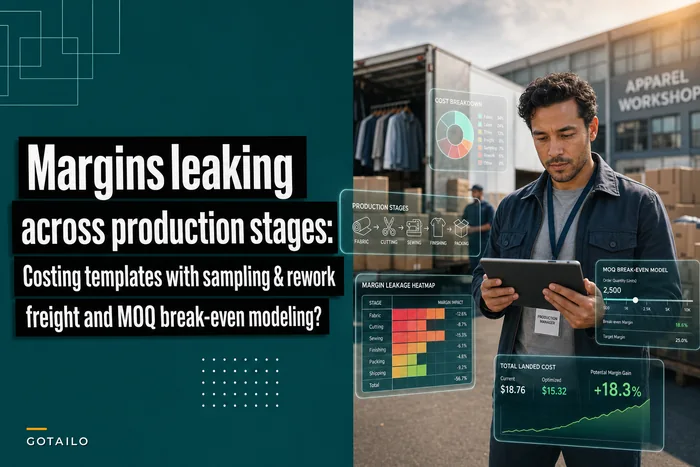

Returns kill apparel margins in two ways. The obvious one: lost sales when items sit in limbo waiting for someone to decide their fate. The hidden one: making the wrong call on whether to repair, refurbish, or liquidate because you're moving too fast without a real triage system in place.
Most fashion brands handle returns like emergency room triage during a disaster — everything feels urgent, nothing has clear criteria, and expensive mistakes pile up. A $280 jacket gets tossed in the liquidation pile when a $12 zipper replacement would've saved it. Meanwhile, a heavily pilled sweater goes to refurbishment when the labor cost already exceeds its resale value.
The difference between profitable returns processing and a money pit comes down to clear decision trees and inspection checkpoints that anyone on your warehouse floor can actually follow. Not vague guidelines about "use your judgment" — actual matrices with dollar thresholds, time limits, and routing rules.
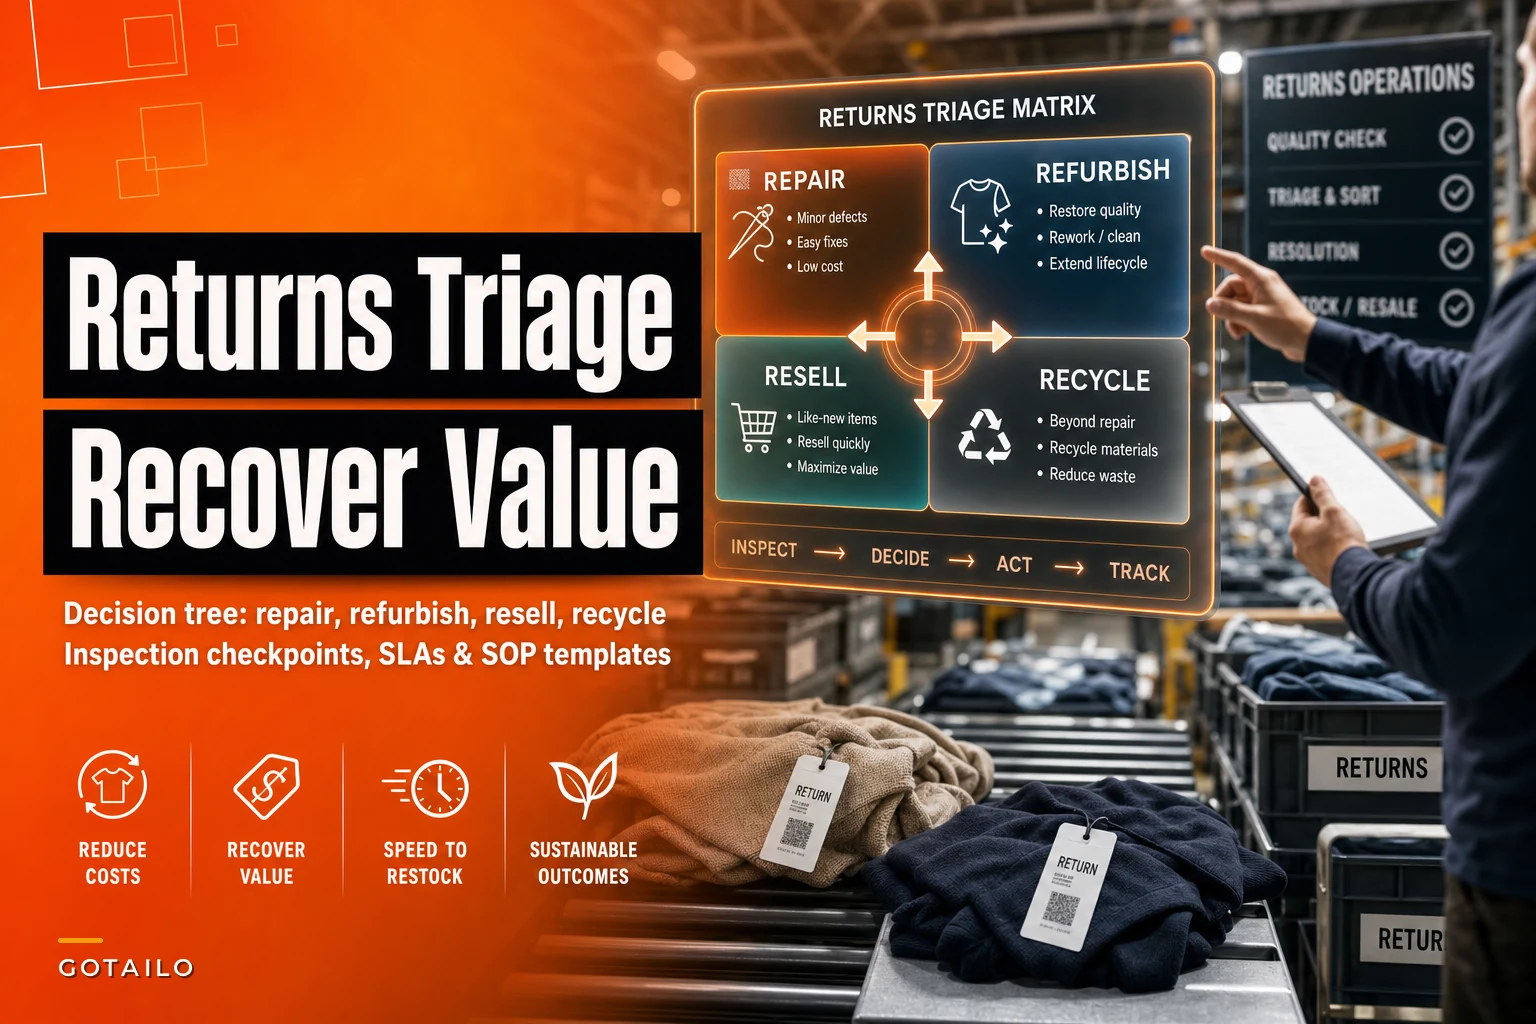
The four-bucket system that actually works
The cleanest operations split everything into four buckets immediately upon receipt.
Bucket 1: Direct restock (usually 15–25% of returns) These items pass initial inspection with original tags attached, no wear signs, no odors, packaging intact. They go straight back to sellable inventory within 24 hours.
Bucket 2: Light refurbishment (typically 30–40%) Minor issues that take under 15 minutes to fix — missing buttons, loose threads, wrinkled items needing steaming, or items that just need repackaging. Your team handles these in-house with basic equipment.
Bucket 3: Heavy repair/refurbishment (around 20–30%) Damaged zippers, torn seams, significant staining, items needing professional cleaning. These require an actual cost-benefit look because repair expenses can quickly eat past recovery value.
Bucket 4: Liquidation/recycle (remaining 15–35%) Items beyond economic repair, out of season past the recovery window, or with hygiene issues that policy prohibits reselling.
The percentages shift by brand and season, but having four clear categories prevents the common mistake of treating every return as its own judgment call. Your team needs a repeatable process, not a different conversation every time.
Building your triage decision matrix
This is where most brands stumble — they build inspection checklists without connecting them to financial thresholds. You end up with warehouse staff spending 45 minutes repairing a $35 item that'll resell for $20.
Eliminate delays in your fashion production cycle.
GoTailo helps you manage designs, orders, and inventory effortlessly, keeping production on schedule.
- Centralized order and inventory management
- Real-time supplier communication
- Integrated production scheduling
No credit card required
A functional triage matrix needs three things working together.
Component 1: Value recovery calculation
Start with the item's potential resale value, not its original price. A $200 dress might only fetch $80 on your outlet site after return processing. That $80 is your ceiling for total processing costs.
From that ceiling, subtract your labor time at loaded hourly rate, materials and supplies needed, storage cost during processing, shipping if outsourcing repair, and opportunity cost of delayed inventory turn. If you're left with less than 30% margin after these costs, the item usually belongs in liquidation. The 30% threshold gives you buffer for miscalculations and things that go sideways mid-repair.
Track margin recovery by SKU for the first 90 days after implementing thresholds to spot miscalibrated limits quickly.
Component 2: Time-to-decision SLAs
-
Initial sort
Within 4 hours of receipt
-
Inspection complete
Within 24 hours
-
Repair/refurb decision
Within 48 hours
-
Processing complete
Within 5 business days
Missing these windows triggers automatic routing to liquidation. Harsh? Maybe. But it beats having months of returns clogging your warehouse while someone debates whether to fix them.
Component 3: Inspection checkpoint standards
Generic "check for damage" instructions waste time and miss problems. Your inspection points need specificity.
Fabric/material checks:
-
Run hands across all surfaces checking for pills, pulls, snags
-
Smell test for smoke, perfume, body odor (immediate fail)
-
Check care label — is it still attached and readable?
-
Examine stress points
underarms, crotch seams, pocket corners
Construction checks:
-
Test all zippers with three full open/close cycles
-
Tug test on buttons (should withstand around 5 pounds of pressure)
-
Examine all seams under tension
-
Check elastic retention (should snap back within 2 seconds)
Appearance checks:
-
Compare color to master sample under standard lighting
-
Look for makeup stains on collar/neckline
-
Check for deodorant marks
-
Examine for pet hair (more than 5 strands = deep clean needed)
Each checkpoint gets a pass/fail score. Three or more fails typically mean liquidation. One or two fails trigger the repair evaluation.
The repair/refurbish workflow that prevents bottlenecks
Even with clear triage criteria, returns pile up when the workflow has hidden bottlenecks. The usual culprit: waiting for approval on edge cases. Someone finds a $150 coat with a broken zipper, can't decide if repair makes sense, emails their manager who's in meetings all day, and the coat sits for 72 hours before anyone makes a call.
The workflow structure below keeps items moving.
[Station 1: Primary Sort] → [Station 2: Detailed Inspection] → [Station 3: Repair Evaluation] → [Station 4: Processing]
Station 1: Primary sort (Hour 0–4) Worker receives return, checks for obvious restock potential — tags on, no wear. Restock items go directly to Station 4. Everything else moves to Station 2.
Station 2: Detailed inspection (Hour 4–24) Inspector runs through the checkpoint list, documents issues in a simple tracking sheet. Items get tagged with colored cards:
-
Green
Light refurb (in-house)
-
Yellow
Heavy repair (needs evaluation)
-
Red
Liquidate
Station 3: Repair evaluation (Hour 24–48)
| Original Price Range | Max Repair Cost | Max Time Investment |
|---|---|---|
| Under $50 | $8 | 10 minutes |
| $50–$100 | $20 | 20 minutes |
| $100–$200 | $40 | 35 minutes |
| $200–$500 | $75 | 60 minutes |
| Over $500 | Case-by-case | Case-by-case |
No debates, no emails. If repair exceeds these limits, the item goes to liquidation.
Station 4: Processing (Hour 48–120)
-
Green tags
Steam, repackage, minor fixes
-
Approved yellows
Repair queue with 5-day completion deadline
-
Reds
Batch for liquidation pickup
Here's a visual of that station flow you can pin in the sorting area.
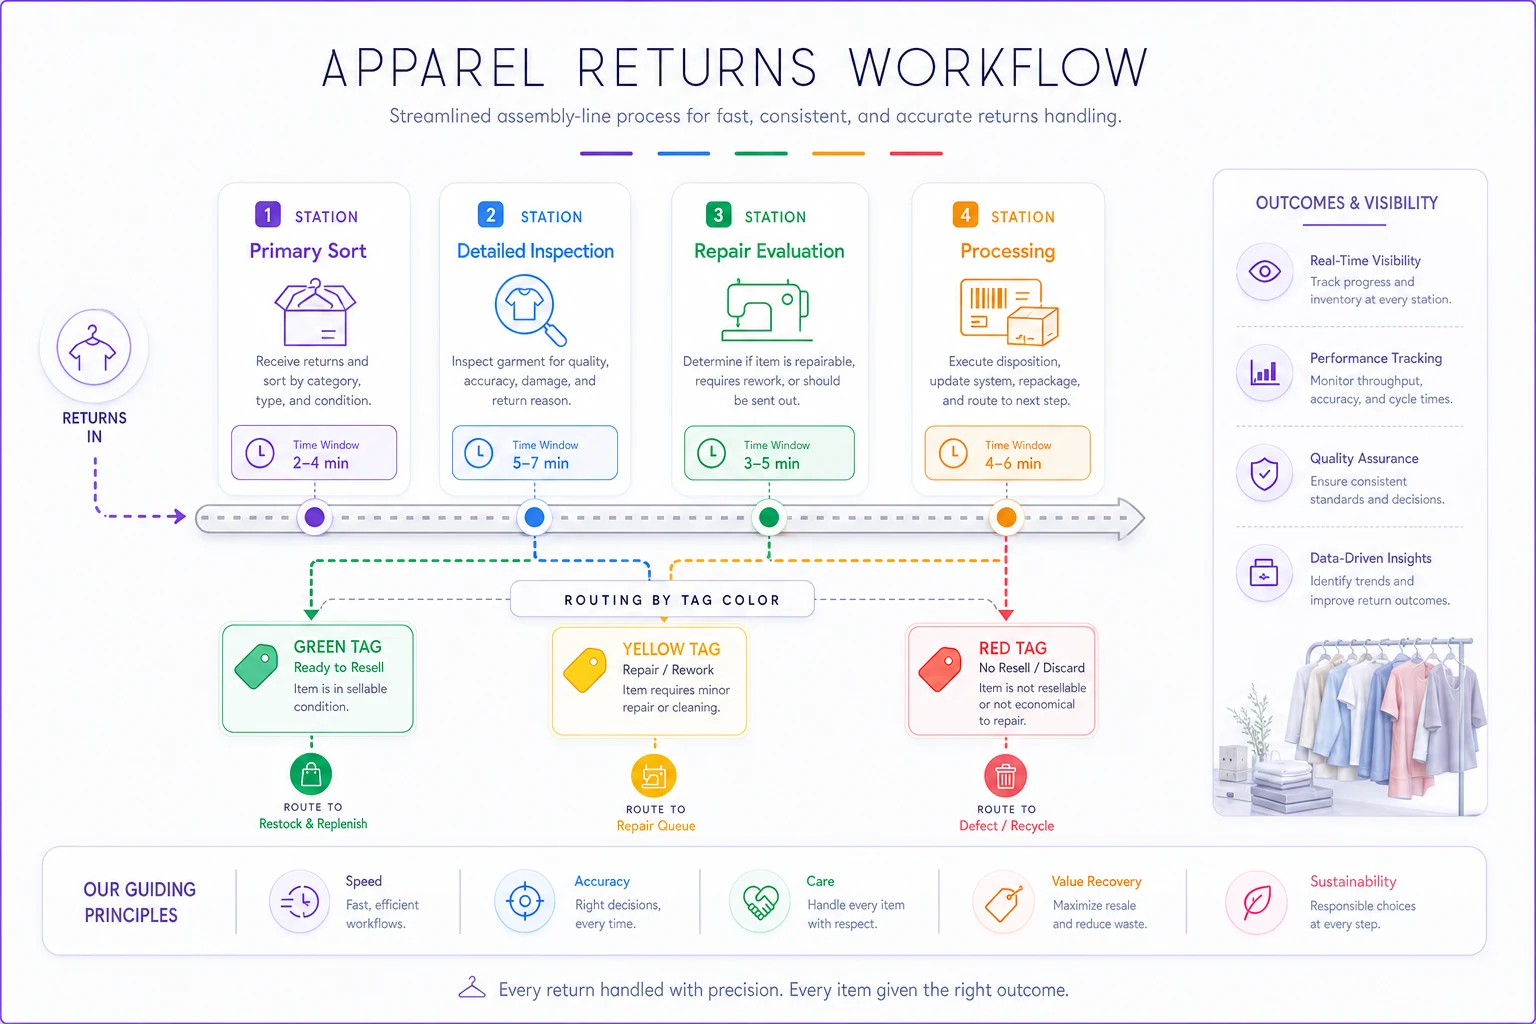
This assembly-line approach means items never sit waiting for decisions. Each station has clear handoff criteria, and workers don't need fashion expertise — just the ability to follow inspection protocols and read a threshold chart.
Accounting for recovered value (the part everyone forgets)
Returns processing often operates in a financial black box. You know items are getting processed, but you can't tell if you're recovering 20% or 60% of potential value. Without tracking recovery rates by category and decision type, you have no way to know whether your triage criteria actually work.
The accounting flow needs to capture three moments.
At return receipt: original sale price, current market value (what similar items sell for now), and condition category from initial sort.
After triage decision: processing cost in labor and materials, routing decision, and estimated recovery value.
After final disposition: actual resale price if restocked or refurbished, liquidation recovery (usually somewhere between 5–15% of retail), and write-off amount if recycled or destroyed.
Most brands skip this tracking because it feels like overhead. But without data on recovery rates, you can't optimize your triage thresholds. Maybe you're spending too much on repairs that don't pay off. Maybe you're liquidating items that would've sold closer to full price with minor fixes.
Similar to tracking margins across production stages, returns processing needs its own P&L view. The math gets complex when you factor in storage costs, opportunity costs, and seasonal devaluation — but even basic tracking beats running completely blind.
Creating SOPs your temporary warehouse staff can actually follow
Returns spike during sales seasons when you're most likely running with temporary staff. These workers need SOPs they can follow without extensive training or fashion knowledge. Abstract instructions like "assess overall quality" guarantee inconsistent decisions and processing delays.
Your returns SOP should read more like a technical manual than a fashion guide.
SOP Section 1: Initial receiving
-
Scan return authorization barcode
-
Match item to original order (style number, size, color)
-
Check return window — automatically flag if past 30/60/90 days per policy
-
Photograph item condition for record
-
Apply initial sort tag (restock candidate or needs inspection)
SOP Section 2: Inspection protocol
-
Place item on inspection table under standard lighting (minimum 2000 lumens)
-
Start inspection timer (max 5 minutes per item)
-
Run through 12-point checklist, marking Y/N for each
tags attached and readable, original packaging present, odor detected, stains visible (photograph if yes), fabric damage (mark location on diagram), construction issues such as zipper, button, or seam problems, and continue through remaining points
-
Count total "N" responses
-
Apply routing tag based on failure count
SOP Section 3: Refurbishment standards
For light refurbishment:
-
Steam by fabric type — cotton on high heat with medium steam, polyester on medium heat with low steam, silk and wool on low heat hovering only
-
Trim loose threads to 1mm from seam
-
Replace buttons matching size within 1mm and color within one shade
-
Repackage in new poly bag, fold per brand standards, include return slip
For heavy repair routing:
-
Complete repair estimate form
-
Check against threshold matrix
-
If approved, create repair ticket with deadline
-
If rejected, move to liquidation queue
-
Update tracking system with decision
The specificity might seem excessive, but it eliminates the guesswork that slows processing down and creates inconsistent outcomes across shifts.
Technology that changes the returns equation
Modern returns processing increasingly relies on AI-powered operational software to handle volume and complexity that manual systems can't keep up with. These platforms can automatically categorize returns based on images, predict repair costs using historical data, and route items through your workflow without someone having to make every individual call.
For smaller operations, even basic workflow automation makes a meaningful difference. Instead of tracking returns across spreadsheets, operational platforms centralize everything — from initial receipt through final disposition. Your team sees exactly where each item stands, what decisions are pending, and which deadlines are approaching.
The real value comes from pattern recognition over time. Good returns management software can identify which items consistently come back, which repairs actually result in successful resales, and which triage decisions consistently lose money. That kind of analysis would take weeks to pull together manually.
What typically improves when brands implement proper returns automation: processing time drops from 8–10 days to 3–4 days, recovery rates improve through better triage decisions, labor costs decrease as workers follow clearer workflows, fewer items hit liquidation unnecessarily, and seasonal items get processed before losing most of their value.
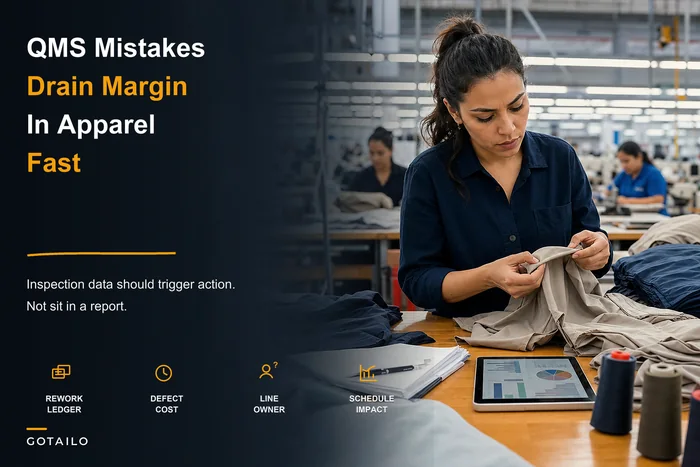
Just like QMS mistakes that create hidden costs, poor returns handling silently erodes margins. The difference is that returns problems are immediately visible — they literally pile up in your warehouse.
When to outsource vs. handle in-house
Not every brand should process their own returns. The decision depends on volume, complexity, and available resources.
Keep returns in-house when:
-
Processing under 200 items weekly
-
Most returns need simple fixes like repackaging or steaming
-
You have warehouse space sitting idle
-
Your team has capacity during slow periods
-
You're still learning your return patterns
Consider outsourcing when:
-
Returns exceed 500 items weekly
-
Complex repairs dominate, such as tailoring or parts replacement
-
Warehouse space costs more than 3PL fees
-
Returns are creating consistent overtime labor costs
-
You lack equipment for proper refurbishment
The hybrid approach often works best — handle restock and light refurbishment internally while sending heavy repairs to specialists. Simple decisions stay fast, complex repairs get professional handling.
Turning returns from cost center to profit recovery
Returns will always represent lost opportunity, but the gap between initial sale and recovered value doesn't have to be massive. Brands recovering 60–70% of value through smart triage consistently outperform those accepting 20–30% liquidation rates as normal.
The goal isn't perfecting every decision — it's having a system that makes good decisions consistently and quickly. When your team knows exactly how to evaluate each return, when to attempt repair, and when to cut losses, returns processing becomes just another operational workflow instead of a daily crisis.
Start with the basic four-bucket sort. Build your inspection checklist around actual failure points in your specific products. Set repair thresholds based on real recovery data, not gut feelings. Track what percentage of items successfully resell after refurbishment.
Within a few months, you'll see patterns: certain styles always need zipper repairs, specific colors show wear faster, some suppliers' construction holds up better under repeated use. These insights inform both your forward purchasing decisions and your returns processing protocols.
The brands that handle returns best don't treat them as an afterthought. In apparel, where return rates run anywhere from 20–40%, recovery optimization directly impacts bottom-line profitability. A proper triage system isn't just about clearing warehouse space — it's about recovering margin that would otherwise disappear into the liquidation abyss.
Returns will always represent lost opportunity, but the gap between initial sale and recovered value doesn't have to be massive. Brands recovering 60–70% of value through smart triage consistently outperform those accepting 20–30% liquidation rates as normal.
Ready to tailor your apparel operations?
Join 500+ fashion brands using GoTailo to accelerate product launches, reduce waste, and improve supplier collaboration.