



Your best denim supplier just shipped 3,000 units with inconsistent washing. The backup factory in Vietnam keeps missing inline inspection dates. That new knit vendor promised better pricing but their defect rate is sitting around 18%. Meanwhile, your production manager is burning half their week on damage control calls instead of actually moving production forward.
This isn't a one bad supplier problem. It's a missing system problem — no structured way to track, evaluate, and address performance before it eats into margins and blows up delivery schedules.
Most apparel brands under $50M run on what you might call relationship-based supplier management. Problems get tracked in spreadsheets. Angry emails go out when things go sideways. Occasionally someone threatens to pull orders. But there's no real system behind any of it, and good relationships don't automatically translate to good production.
Without a proper supplier scorecard system, you're absorbing problems instead of managing them. Patterns go unnoticed. By the time you realize a supplier needs serious intervention, you've already taken months of quality hits, delays, and margin erosion.
Why traditional vendor management breaks down in apparel
Apparel manufacturing has specific challenges that generic supplier scorecards completely miss. You're managing seasonal collections, fabric variations, multiple production stages, and quality standards that shift between product categories. A vendor who crushes basics might completely fall apart on technical outerwear.
A typical apparel brand works with somewhere between 8 and 15 active suppliers across different categories and regions. Some handle fast-turn basics. Others specialize in detailed construction. Running them all through the same scorecard criteria produces scores that don't mean much.
Then there's the capacity situation. Your suppliers are juggling multiple clients, and you're probably not the biggest one. When another brand drops a large order, your lead times stretch from 45 to 65 days, quality inspectors get reassigned, and your dedicated production line quietly becomes shared. These shifts happen constantly. Without tracking capacity utilization and order book changes, you won't see the warning signs until it's already too late.
Geographic spread adds another layer. A framework that works for your domestic cut-and-sew shop won't translate cleanly to a factory in Bangladesh or a finishing house in Turkey. Different holiday schedules, different quality expectations, different communication styles, different remediation timelines.
The real problem is that most brands discover supplier issues through customer complaints or warehouse inspections — way too late to course-correct without pain. The defective goods are already shipped and sitting in your DC.
Building a tiered supplier scorecard specific to apparel operations
A functional scorecard needs both quantitative metrics and qualitative factors that actually predict future performance. Forget generic templates. You need categories built around how apparel manufacturing actually works.
Eliminate delays in your fashion production cycle.
GoTailo helps you manage designs, orders, and inventory effortlessly, keeping production on schedule.
- Centralized order and inventory management
- Real-time supplier communication
- Integrated production scheduling
No credit card required
Four core scoring dimensions:
Quality Performance (35% weight) Track defect rates by product category, not just overall. A 2% defect rate on basic tees might be acceptable. On tailored blazers, that same rate can wreck your reputation. Track first-pass yield, rework rates, and customer returns linked to specific suppliers. Also track consistency — a supplier running 1–3% defects consistently is more valuable than one swinging between 0% and 8%.
Delivery Reliability (30% weight) Beyond on-time delivery, track schedule adherence at each production milestone. Did they hit the PP sample deadline? Lab dip approval? Bulk fabric arrival? A supplier can still deliver final goods on time by rushing through quality checks — that's not actual reliability. Weight early-stage milestones higher. They give you more time to react.
Communication & Responsiveness (20% weight) This is quantifiable. Track response times to production queries, completeness of updates, accuracy of capacity forecasts, and proactive problem reporting. A supplier who flags a potential delay three weeks out scores significantly higher than one who goes quiet until the ship date passes.
Cost Management (15% weight) Not just about pricing. Track pricing consistency, hidden charges, rework costs, and total landed cost variations. Include their flexibility on payment terms and willingness to share cost breakdowns. Transparent, predictable pricing often delivers better margins than the "cheapest" option.
| Metric Category | Specific KPIs | Measurement Method | Score Range |
|---|---|---|---|
| Quality Performance | Defect rate by category | QC reports + returns | 0-10 scale |
| First-pass yield | Inline inspection data | Percentage | |
| Consistency score | Standard deviation of defect rates | Low/Med/High | |
| Delivery Reliability | Milestone adherence | Production tracker | Days early/late |
| Proactive delay alerts | Communication log | Count per season | |
| Capacity accuracy | Promised vs actual | Percentage variance | |
| Communication | Query response time | Email/portal tracking | Hours |
| Update completeness | Checklist scoring | Percentage | |
| Documentation quality | Tech pack compliance | Pass/Fail/Partial | |
| Cost Management | Invoice accuracy | Variance reports | Error rate |
| Cost transparency | Breakdown availability | Yes/Partial/No | |
| Payment flexibility | Terms offered | Net days |
Scoring should adjust for order complexity and supplier tier. Core suppliers handling complex construction get evaluated differently than spot vendors doing simple reorders.
Creating remediation timelines that actually drive improvement
Spotting problems means nothing without structured follow-through. Most brands either overreact — threatening to cancel everything — or underreact with endless "monitoring" that never turns into action. You need escalation levels tied to specific score thresholds and real timelines.
Tier 1: Performance Watch (Score 70–79) Timeline: 60-day improvement period Actions: Bi-weekly check-ins, root cause analysis on main issues, joint improvement plan Triggers: Single category below 7/10 or overall score drops below 80 Exit criteria: Score above 80 for 30 consecutive days
This is where you address emerging issues before they become systematic. Maybe defect rates crept up after they hired new sewers. Maybe lead times stretched because their fabric supplier changed. These problems are usually fixable with attention and some modest process adjustments.
Tier 2: Formal Remediation (Score 60–69) Timeline: 45-day remediation sprint Actions: Daily production monitoring, on-site visit or virtual audit, CAPA implementation, order volume restrictions Triggers: Two categories below 6/10 or a critical quality failure Exit criteria: Demonstrate systematic improvements and pass reinspection
This requires intensive intervention. You may need to station your own QC personnel at their facility, add checkpoints, or restructure payment terms to create real incentives. New orders pause until improvement is demonstrated.
Tier 3: Probation Status (Score below 60) Timeline: 30-day final notice Actions: No new orders, expedited replacement sourcing, legal review of contracts, transition planning Triggers: Failed Tier 2 remediation or critical systematic failure Exit criteria: Dramatic operational changes or relationship termination
At this point you're actively planning for vendor replacement while giving them one last window to turn things around. This connects to the visibility signals that indicate when a supplier relationship is truly unsalvageable.
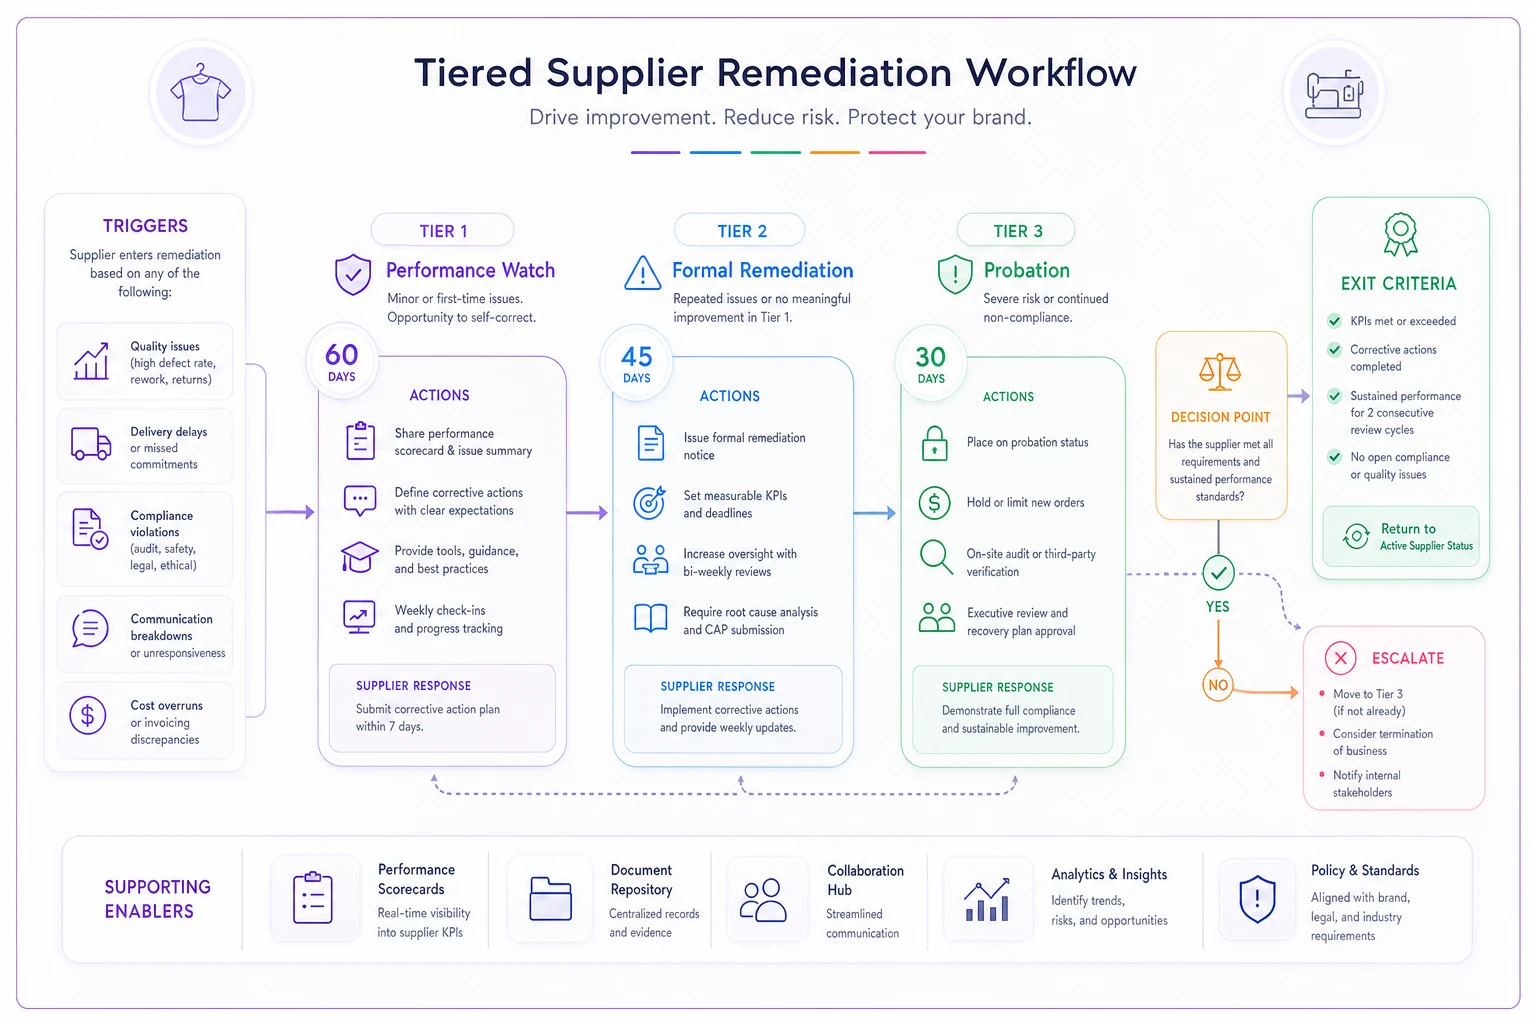
The key is actually following through on these timelines. Suppliers learn fast whether your scorecards have teeth or are just paperwork.
CAPA templates designed for apparel production realities
CAPA plans in apparel can't be generic quality management exercises. They need to address the specific failure modes common in garment production, and they need to be simple enough that suppliers will actually use them.
Your CAPA template should require suppliers to answer:
-
Problem Definition — Specific defect or failure (not "quality issues"), quantity affected and style numbers, when the problem was first detected, current impact on production.
-
Root Cause Analysis — Use the 5 Whys, but require evidence. Common apparel root causes: operator training, pattern/marker issues, fabric quality, equipment calibration, process documentation. Differentiate between immediate and underlying causes.
-
Immediate Containment — How will current production be addressed? Rework plan and timeline, additional inspection points, customer notification if needed.
-
Corrective Actions — Specific process changes, training requirements, equipment modifications, documentation updates, timeline with milestones.
-
Preventive Actions — How will this be prevented going forward? Process controls added, inspection criteria updated, supplier audit requirements.
-
Verification Method — How will improvement be confirmed? Sampling plan, measurement criteria, sign-off requirements.
A real CAPA for a common issue might look like this:
Problem: Shoulder seam puckering on styles KN-401 through KN-412
Root Cause: Tension settings not adjusted for lighter weight knit fabric, combined with operators using standard seam technique instead of the modified approach required for stretch fabrics
Immediate Fix: Rework 1,200 affected units, implement 100% inspection at shoulder seam station
Corrective Action: Retrain 8 operators on stretch fabric handling, create tension adjustment chart posted at each station, add fabric weight check to cutting ticket
Preventive Action: Update operator certification to include stretch fabric module, add tension verification to hourly quality rounds
Verification: Zero defects on next 500 units, maintain below 0.5% defect rate for 30 days
CAPAs get tracked in your scoring system. Suppliers who complete them on schedule and show sustained improvement get positive score adjustments. Generic responses or failed verification get penalized.
Contractual levers beyond the nuclear option
Your supplier contracts probably have termination clauses. But threatening to cancel orders every time something goes wrong destroys relationships and rarely improves anything. You need graduated levers that create real consequences without burning bridges unnecessarily.
Financial Penalties and Incentives Structure payments to reward good performance, not just penalize problems. Something like 5% of payment held in a quality bonus pool, released quarterly based on scorecard results. Defect rates above threshold trigger automatic chargebacks. Early delivery earns expedited payment. These mechanisms create immediate financial feedback.
Capacity Allocation Rights Write in the ability to adjust order volumes based on performance. Top-tier suppliers get right of first refusal on new styles. Middle-tier get standard allocation. Bottom-tier see volumes shifted to better performers. When scorecard rankings directly impact supplier revenue, people pay attention.
Inspection and Audit Rights Specify that poor scores trigger increased inspection at supplier expense. Below 70? Third-party inspection required on all orders. Below 60? Unlimited audit rights with 48-hour notice. This shifts quality control costs to whoever is causing quality problems.
Intellectual Property Controls For suppliers handling custom designs or proprietary techniques, tie IP rights to performance. Poor scores could trigger earlier reversion of sampling rights or restrictions on producing similar styles for competitors. This matters more than people realize for technical or innovative products.
Remediation Cost Recovery Define clearly who pays for fixes. Defects discovered after shipping — supplier covers air freight for replacements. Quality issues requiring rework — charged back at local labor rates plus overhead. Late deliveries requiring expedited shipping — comes from supplier margins.
Exit Clause Modifications Instead of hard termination, include structured wind-down provisions. A supplier on probation might have orders gradually reduced over 90 days rather than cut immediately. Protects your production continuity while making the consequences clear.
Sample contract language: "Supplier scorecard ratings below 70 for two consecutive quarters will result in: (a) 25% reduction in allocated capacity for the following season, (b) payment terms shifting from Net 30 to COD, (c) mandatory third-party inspection at Supplier expense for all production runs exceeding $10,000, (d) Company right to resource any pending orders with less than 30% completion."
Capacity rebalancing playbooks when suppliers fail
When a supplier enters remediation or needs replacing, you can't just stop production. You need a systematic approach to shift capacity without destroying your delivery calendar.
The Graduated Shift Strategy Don't move everything at once. Start with the most problematic categories. If a supplier handles both basics and fashion items but quality issues are concentrated in fashion, move fashion first while maintaining basics. This preserves some volume leverage during the transition.
The timeline roughly looks like this:
-
Weeks 1–2
Identify replacement suppliers and check capacity
-
Weeks 3–4
Run parallel sampling with alternatives
-
Weeks 5–6
Place test orders (5–10% of normal volume)
-
Weeks 7–8
Evaluate results and pricing
-
Weeks 9–12
Gradually shift production based on performance
The Portfolio Rebalancing Method Sometimes the answer isn't finding one replacement but redistributing across existing suppliers. If Supplier A drops to probation, you shift 30% to Supplier B, 30% to Supplier C, and only need to source new capacity for the remaining 40%. This requires maintaining some excess capacity across your network — not free, but critical for flexibility.
The Hybrid Production Approach For complex products, splitting production stages sometimes makes sense. Keep cutting and initial assembly with the problematic supplier if that's where they're competent, but move finishing and packing elsewhere. More coordination required, but it preserves specialized capabilities while addressing weak points.
Emergency Capacity Networks Maintain relationships with two or three backup suppliers even when you're not actively ordering. Send them tech packs for quotes annually. Place small test orders to keep the relationship current. When you need emergency capacity, they can respond quickly — versus starting from scratch, which takes months.
One mid-sized activewear brand lost a major supplier to bankruptcy with 4,000 units mid-production and recovered most of it within three weeks across three alternate suppliers — because they'd maintained backup relationships and had clear rebalancing protocols. Without that preparation, they would've missed the entire season.
The rebalancing playbook should include:
-
Supplier capability matrix (who can make what)
-
Capacity availability tracker (updated monthly)
-
Pricing comparison sheets (kept reasonably current)
-
Sample approval history (which suppliers succeeded or failed on which products)
-
Transition cost calculator (sampling, tooling, logistics changes)
-
Communication templates for customers about potential delays
The rebalancing playbook should include the items above and be updated regularly so it functions as a real operational tool rather than a theoretical document.
Operationalizing scorecards in small teams without dedicated vendor management
Small apparel brands rarely have a dedicated vendor management function. Usually it's the production manager handling supplier relationships alongside everything else. The system has to work within those constraints or it won't survive.
Weekly Scoring Rhythm Don't try to score everything constantly. Set aside a 30-minute window each week to update scores based on that week's activity. Log issues as they happen, convert to scores during the weekly review. This keeps scoring from becoming its own full-time job.
Automated Data Collection Pull from existing systems wherever possible. Defect rates should flow from QC reports. Delivery performance from your production tracker. Even basic operational tracking gives you most of what you need for scoring. The less manual data entry required, the more likely the system actually gets maintained.
Threshold-Based Reporting Not every supplier needs weekly attention. Set triggers so attention goes where it matters most:
-
Score drops 10+ points in a week
Immediate review
-
Score below 75
Weekly monitoring
-
Score between 75–85
Monthly review
-
Score above 85
Quarterly review
Collaborative Scoring Your production coordinator, QC team, and accounting all see different aspects of supplier performance. A simple monthly form where each department rates their interactions gives you a more complete picture than any single person can provide.
Simplified CAPA Tracking Not every issue warrants a full CAPA. Three levels work well:
-
Quick Fix
Problem and solution, tracked in scorecard notes
-
Standard CAPA
One-page form, two-week completion
-
Major CAPA
Full documentation, leadership review
Use the 30-minute weekly scoring window as your team's contract to keep the system lightweight and consistent.
This avoids paperwork paralysis while keeping accountability intact.
When scorecards reveal systemic issues vs isolated problems
After running scorecards for a few months, patterns emerge that tell you whether you're dealing with fixable problems or fundamental incompatibilities. That distinction matters because it drives completely different responses.
Isolated problems look like this: Scores fluctuate but trend upward with intervention. Issues concentrate in specific areas — just quality, or just communication. Root causes trace to identifiable events like new equipment or staff turnover. The supplier shows genuine engagement in improvement, and other clients report similar but manageable issues.
A knit supplier might struggle with a new fabric blend but perform well on everything else. Communication might lag during peak season and recover during slower periods. These patterns suggest targeted fixes can work.
Systemic issues look different: Scores stay low despite multiple interventions. Problems span every category. Root causes point to business model misalignment or culture issues. Improvement efforts feel forced and temporary. Other clients are also quietly reducing volumes or leaving.
When a supplier consistently deprioritizes smaller clients, lacks basic quality infrastructure, or operates on fundamentally incompatible timelines, scorecards won't fix the underlying problem. Isolated issues get remediation plans. Systemic issues trigger replacement sourcing. Spending six months trying to salvage an incompatible supplier relationship costs more — in time, money, and missed seasons — than finding and onboarding two new suppliers.
Making scorecard data drive actual decisions
The biggest failure with supplier scorecards is that they become report cards no one reads. The data needs to drive real operational decisions, not just live in a spreadsheet.
Production Planning Integration Low-scoring suppliers get simpler products and longer lead times. High scorers get priority on rush orders and complex styles. Build this into your planning process — when assigning production, the scorecard rating should appear alongside each supplier option.
Pricing and Negotiation Bring scorecards to pricing conversations. A supplier pushing for a price increase while sitting at 68/100 gets a different response than your 92/100 strategic partner. Performance data justifies pushing back on increases or defending premiums for reliability.
New Product Development Your best suppliers should get first access to new categories or innovative products. Meanwhile, struggling suppliers stay on basic reorders until they demonstrate improvement. That creates a real incentive to perform.
Capacity Planning When planning next season, scorecard trends tell you where to increase or reduce allocations. A supplier trending downward over two consecutive quarters probably shouldn't be holding 40% of next season's production, regardless of their pricing.
Investment Prioritization If you're considering investing in supplier capabilities — funding equipment or training programs — scorecards show where that investment actually pays off. Putting resources into improving a 60/100 supplier rarely makes sense when you could be helping an 80/100 supplier reach 95.
The technology reality for scorecard systems
Most small apparel brands start with Excel or Google Sheets. It works fine early on, but breaks down as complexity grows. Tracking 15 suppliers across 8 metrics with weekly updates, monthly reviews, and CAPA tracking on top — you end up spending more time managing the system than actually improving supplier relationships.
Modern operational platforms built for apparel can automate the tedious parts: pulling defect rates from QC reports, calculating on-time delivery from production trackers, flagging overdue CAPAs, adjusting capacity allocations when scores change. AI-assisted analysis can surface patterns that are hard to catch manually — correlations between fabric types and supplier performance, seasonal quality trends, suppliers whose scores are quietly drifting in one direction.
The real value is in connecting scorecards to other operational workflows. When a supplier score drops below a threshold, capacity allocation for next season adjusts automatically. When a CAPA goes overdue, payment terms shift. When scores improve, the supplier gets flagged for new product opportunities. These feedback loops drive improvement without requiring constant manual follow-up.
That said, better tools don't replace operational discipline. Scorecards only work when your team commits to using them consistently, acting on the data, and following through on consequences. Technology makes it more manageable — it doesn't make the hard decisions for you.
Building supplier accountability that actually scales
Supplier scorecards aren't about finding perfect suppliers. They don't exist. They're about making performance visible, predictable, and manageable — so problems get caught earlier, patterns become clear, and consequences are consistent enough that behavior actually changes.
The framework here — tiered scoring, structured remediation, practical CAPAs, graduated consequences, and capacity flexibility — works whether you're managing 5 suppliers or 50. Start with the core metrics that matter most to your operation. Add layers as your team develops the capability and your business grows.
Most importantly, scorecards are tools for improvement, not punishment. The goal is helping suppliers deliver what your business needs. When that stops being possible, scorecards give you the data and structure to make changes professionally rather than reactively.
Your next collection's success depends as much on supplier performance as it does on design. Without systematic supplier management, you're hoping for good outcomes rather than building systems that produce them. Hope isn't a production strategy — but a well-run supplier scorecard system is.
Supplier scorecards aren't about finding perfect suppliers. They don't exist. They're about making performance visible, predictable, and manageable — so problems get caught earlier, patterns become clear, and consequences are consistent enough that behavior actually changes.
Ready to tailor your apparel operations?
Join 500+ fashion brands using GoTailo to accelerate product launches, reduce waste, and improve supplier collaboration.