



Most apparel brands look at gross margin by SKU and stop there. Landed cost, retail price, done. The problem is that the same SKU almost never costs the same to actually sell and deliver depending on where it goes. A $58 hoodie sold direct-to-consumer carries pick-pack, a free-shipping subsidy, a payment fee, a return risk, and a chunk of customer acquisition. That exact same hoodie sold wholesale to a boutique carries EDI compliance, chargeback exposure, markdown money, and net-60 terms that quietly eat cash.
When you don't split those costs out and pin them to the SKU and the channel, you end up with a margin number that's technically correct and operationally useless. You expand the channel that looks most profitable and later wonder why blended margin dropped even though every product line "makes money."
This is a walkthrough of how to build channel cost to serve apparel buckets, pick allocation keys that aren't nonsense, do the SKU-level math for a D2C vs wholesale example, and set a reconciliation cadence so the numbers don't drift three months into a season.
The gap between gross margin and true margin
A pattern that shows up constantly: a brand runs both a Shopify store and a wholesale program. The merchandising team pulls a margin report, sees wholesale gross margin at 52% and D2C at 64%, and concludes D2C is the better business. So next season they buy deeper into D2C-heavy SKUs.
Two things were missing from that comparison.
The 64% D2C margin was before paid acquisition, before the 22% return rate on dresses, before the free-shipping threshold most customers barely clear, and before the 2.9% + $0.30 payment processing on every order. And the 52% wholesale margin ignored that wholesale gets paid in one clean shipment, has near-zero returns, and requires almost no marketing spend per unit.
Pull all of that through and the "obvious" ranking can flip entirely. In real operations this usually happens because gross margin lives in one system — your costing sheet or ERP — and cost-to-serve is scattered across 3PL invoices, ad platforms, payment processors, and wholesale markdown accruals nobody reconciles until year-end.
Build your cost-to-serve buckets first
Before you allocate anything, you need clean buckets. Vague buckets create vague allocations. For apparel specifically, these are the ones that actually move the needle. Keep them separate — don't lump "fulfillment" into one line because the drivers underneath behave completely differently.
Eliminate delays in your fashion production cycle.
GoTailo helps you manage designs, orders, and inventory effortlessly, keeping production on schedule.
- Centralized order and inventory management
- Real-time supplier communication
- Integrated production scheduling
No credit card required
| Cost-to-serve bucket | What's in it | Primarily hits |
|---|---|---|
| Pick, pack & outbound labor | Warehouse labor, carton/polybag, dunnage, pack station time | D2C heavily, wholesale lightly |
| Outbound freight | Parcel (D2C) vs LTL/FTL (wholesale), shipping subsidies | Both, very differently |
| Returns & reverse logistics | Return shipping, inspection, refurb, restock, write-off | D2C heavily |
| Payment & financing cost | Processing fees, net-term carrying cost, factoring | Split by channel terms |
| Customer acquisition | Paid media, affiliate, email/SMS platform cost | D2C almost entirely |
| Channel compliance | EDI, routing-guide labor, GS1 labels, chargebacks | Wholesale almost entirely |
| Markdown & allowances | D2C promo discounts, wholesale markdown money, co-op | Both |
| Platform & commission | Marketplace fees, retailer commissions, Shopify % | Channel-specific |
Two of these buckets — returns and acquisition — are where the D2C "margin advantage" usually dies, and neither appears on a standard costing sheet. If your costing templates already capture sampling, rework, and freight at the production stage, you're halfway there; this is the downstream continuation of that same discipline. If your production-stage costing is still shaky, fix that first — there's a full breakdown in the costing-templates post on production-stage margin leaks.
Allocation keys: the part everyone gets lazy about
Buckets are easy. Allocation keys are where brands quietly cheat themselves by spreading everything evenly "per unit," which produces garbage outputs.
-
Pick/pack labor → allocate by order lines and units, not revenue. A D2C order of 1.3 units costs nearly a full pick event; a wholesale order of 400 units costs one bulk pick. Revenue-based allocation would massively overcharge the wholesale SKU here.
-
Outbound freight → allocate by actual shipping profile. D2C by parcel weight/dim and zone; wholesale by LTL cost spread across the pallet's units.
-
Returns → allocate by category return rate, applied at SKU level. Dresses and fitted outerwear carry a different rate than tees. Flat per-unit return allocation hides your worst offenders.
-
Acquisition → allocate by channel and ideally by SKU contribution to new-customer orders. A hero SKU that pulls first orders carries more; a basic that only sells as an add-on carries less.
-
Payment/financing → allocate by channel terms. D2C
processing % on order value. Wholesale: carrying cost of net-60 at your actual cost of capital.
-
Compliance/chargebacks → allocate only to wholesale, by retailer, then down to the SKUs in those shipments.
-
Markdown/allowances → allocate by where the markdown actually happened. Don't smear retailer markdown money across D2C SKUs.
Allocate each bucket by the driver that actually causes the cost, not by the driver that's easiest to pull.
A common mistake is allocating acquisition cost evenly across every D2C SKU. In reality, a handful of SKUs drive first orders and everything else rides along. Blanket allocation makes your gateway products look unprofitable and your add-ons look like heroes — exactly backward.
Worked example: the same hoodie, two channels
Run one SKU through both channels. Style: mid-weight fleece hoodie. Landed cost $19.40. The numbers here are illustrative but the structure is what matters.
D2C — sold at $58 retail
| Line | Amount |
|---|---|
| Net selling price | $58.00 |
| Promo/discount (avg ~8%) | −$4.64 |
| Landed cost | −$19.40 |
| Payment processing (2.9% + $0.30) | −$1.85 |
| Pick/pack + polybag/carton | −$3.10 |
| Outbound parcel (subsidy portion) | −$5.40 |
| Returns (14% rate, blended cost) | −$3.70 |
| Acquisition (allocated) | −$6.50 |
| Channel-adjusted contribution | ≈ $13.41 (≈ 25%) |
Wholesale — sold at $29 (keystone to boutique)
| Line | Amount |
|---|---|
| Wholesale price | $29.00 |
| Landed cost | −$19.40 |
| Pick/pack (bulk, per unit) | −$0.45 |
| Outbound LTL (per unit) | −$0.80 |
| Compliance/EDI/labels (per unit) | −$0.55 |
| Chargeback reserve (per unit) | −$0.40 |
| Net-60 carrying cost | −$0.35 |
| Markdown allowance accrual | −$0.90 |
| Channel-adjusted contribution | ≈ $6.15 (≈ 21%) |
On gross margin alone, D2C looked dramatically better — 66% vs 33%. After cost-to-serve, the percentages are close (25% vs 21%), but the dollar contribution per unit is more than double in D2C. That's the real decision input: not margin percent, not gross dollars, but channel-adjusted contribution per unit and how much volume each channel can actually absorb.
And notice — if this hoodie's return rate were 24% instead of 14% (very normal for fitted or color-heavy styles), D2C contribution would drop below wholesale. The ranking is SKU-specific, not channel-specific. That's the entire point.
SKU-level margin adjustments that change assortment decisions
Once you've run the buckets through every SKU, you get a view the merchandising team can actually plan against. A few patterns tend to surface:
-
High-return categories quietly subsidize their channel. Dresses and tailored items often look strong on gross margin and weak after returns. These belong on a tighter D2C assortment or need fit and content fixes before you buy deeper.
-
Basics are your wholesale heroes. Low return rate, high reorder, cheap to pick in bulk. Their wholesale contribution is steadier than D2C once acquisition is loaded in.
-
Gateway SKUs justify their acquisition load. If a SKU pulls a disproportionate share of first orders, its high allocated acquisition cost is actually buying lifetime value — don't kill it just because its single-order margin looks thin.
-
Low-velocity wholesale SKUs get buried by compliance overhead. The per-unit EDI and routing cost barely matters on 400 units but is brutal on a 30-unit reorder.
This is where cost-to-serve feeds directly into assortment planning. Buy quantities and channel splits for next season should reflect channel-adjusted contribution, not gross margin — and ideally should be reconciled against actual factory capacity so you're not planning a D2C-heavy buy your production lines can't phase. There's a full treatment of that side in the piece on aligning assortment to factory reality.
The reconciliation cadence (so the numbers don't rot)
Cost-to-serve models die the same way every time: someone builds a solid allocation in a spreadsheet, it's accurate for maybe a month, then 3PL rates change, parcel surcharges hit, return rates shift seasonally, and nobody updates it. Six months later the merchandising team is planning off numbers that are quietly wrong.
A cadence that actually holds up:
-
Monthly — true-up the variable buckets. Pull actual 3PL invoices, parcel bills, payment processor fees, and ad spend. Compare allocated vs actual per channel. Flag any bucket off by more than roughly 10%.
-
Per-season (or per-drop) — reset the rates. Before each buy, refresh the allocation rates: current pick cost per order, current freight profiles, trailing return rate by category, current CAC by channel. These feed the next assortment plan.
-
Quarterly — reconcile the accruals. Markdown money, chargeback reserves, and co-op allowances are accruals, which means they drift. Reconcile what you accrued against what actually got taken. Wholesale markdown accrual is the single most common place brands under-reserve and get hit with a nasty year-end surprise.
-
Annually — rebuild the allocation keys themselves. Not just the rates — the keys. If your channel mix shifted hard (say D2C went from 30% to 55% of volume), the drivers behind some buckets change and the keys need re-examination.
Here's a simple reconciliation workflow.
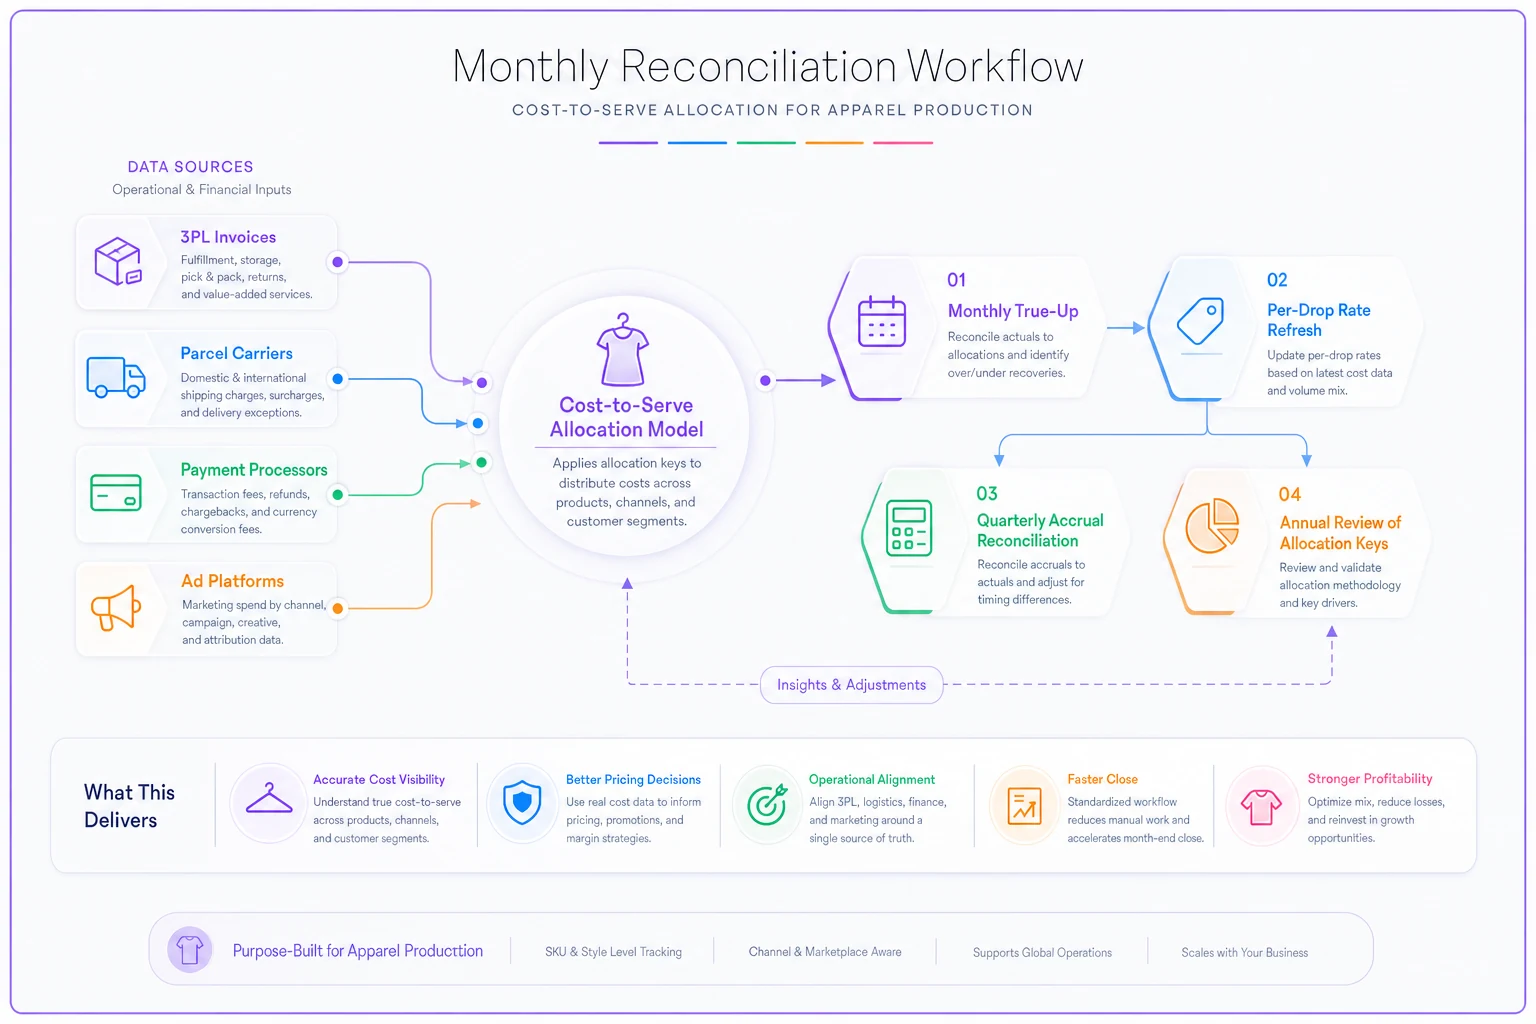
A simple reconciliation checklist
-
[ ] Pulled actual 3PL and parcel invoices for the period
-
[ ] Compared allocated vs actual for each variable bucket
-
[ ] Updated trailing return rate by category, not blended
-
[ ] Refreshed CAC by channel from the ad platform and affiliate reports
-
[ ] Reconciled markdown/chargeback accruals against actual deductions
-
[ ] Flagged any SKU whose channel-adjusted contribution flipped sign
-
[ ] Passed updated rates to merchandising before the next buy
Where this gets painful manually is the data-pulling. Invoices, ad spend, returns, markdown deductions — they live in four or five systems that don't talk to each other. Teams running this inside a shared operational platform usually set it up so 3PL and payment feeds reconcile against allocated buckets automatically, and the monthly true-up becomes a review step instead of a three-day spreadsheet rebuild. That's the realistic role for automation here: it doesn't make the allocation decisions for you, it just keeps the inputs current so the model doesn't go stale between seasons.
A real scenario
A small outerwear and knits brand — roughly $4M revenue, split about 60/40 D2C to wholesale — was planning their next buy heavily toward D2C because blended D2C gross margin ran around 61% vs 49% wholesale.
When they ran cost-to-serve by SKU, two things surfaced. Their fitted D2C dresses were running a 26% return rate; after reverse-logistics cost, several were landing around 11–13% channel-adjusted contribution — barely above breakeven once acquisition was loaded in. Meanwhile their wholesale basics program, unglamorous and "low margin" on paper, was throwing off steady contribution with almost no returns and minimal marketing load.
They didn't abandon D2C. They trimmed the deep buy on the high-return fitted styles, shifted some of that open-to-buy into basics they could push through wholesale, and set a monthly true-up on freight and returns. Nothing dramatic in the headline numbers — blended gross margin barely moved — but contribution dollars improved by a meaningful mid-single-digit percentage over two seasons, mostly because they stopped over-buying SKUs that only looked profitable.
When this is worth doing — and when it isn't
Worth it when: you sell through two or more channels with genuinely different economics, your return rates vary significantly by category, or you're making buy decisions off gross margin and the P&L just doesn't match the "profitable" SKU reports.
Not worth the full build when: you're single-channel with uniform fulfillment and low returns. If everything ships the same way to the same kind of customer, cost-to-serve is roughly flat across SKUs and you can approximate it with a single per-order load. Don't build an eight-bucket allocation model for a business that doesn't have divergent channels yet.
Who should hold off: very early brands still pre-product-market-fit. Your acquisition cost and return rates are too volatile to allocate meaningfully — you'll be modeling noise. Get a few stable seasons of data first, then build it.
The core shift is straightforward to say and annoying to execute: stop ranking SKUs and channels by gross margin and start ranking them by what they actually cost to serve once they leave the production line. The hoodie that looks like a 66% winner in D2C and a 33% afterthought in wholesale is, after the full math, two different businesses with closer margins than anyone expected — and the only way to buy the next season correctly is to see both clearly.
Ready to tailor your apparel operations?
Join 500+ fashion brands using GoTailo to accelerate product launches, reduce waste, and improve supplier collaboration.