


Most fabric overruns don't come from bad sewing or wasteful cutters. They come from a consumption number that was wrong before the fabric was even ordered. Someone took a sample yardage, added a flat 5% "just in case," and rolled it into the purchase order. Then reality showed up: the marker didn't nest as tightly as expected, the knit shrank more than the swatch test predicted, and a few meters got written off to defects nobody planned for.
By the time you notice, you've either over-ordered — dead stock sitting in a corner — or under-ordered, which means a rush buy at a worse price or a delayed shipment. Both hurt. The frustrating part is that the math to prevent this isn't complicated. It's just usually done sloppily, or done once and never checked against what the floor actually used.
This is a walkthrough of how to build a fabric consumption calculation for apparel that actually holds up, how to adjust it for shrinkage, defects, and marker yield, and — the part almost everyone skips — how to run a routine audit comparing your BOM consumption against real roll usage.
Start with the number that isn't the number
The base consumption from a marker or CAD nest is a clean-lab figure. It assumes perfect fabric, perfect nesting, zero waste, and no shrinkage. Nobody produces in those conditions.
The real consumption number is a stack of adjustments on top of that base:
Final consumption per garment = Base marker consumption ÷ (Marker efficiency × (1 − Shrinkage allowance) × (1 − Defect allowance)) — plus end-of-roll and end-loss
That looks messy written out. Here's how most production people actually calculate it, step by step.
The layered adjustment method
-
Base consumption — pull the net yardage from the marker for the size ratio you're actually cutting, not some averaged size.
-
Apply marker efficiency — a marker at 82% efficiency means 18% of the fabric area is waste between pieces. Divide base by efficiency, or use the gross marker length directly if your CAD gives it.
-
Add shrinkage — if your relaxation and wash test shows 4% length shrinkage, you need 4% more length before cutting.
-
Add process/defect allowance — fabric flaws, cut-panel rejects, shading cuts that get discarded.
-
Add end-loss — unusable fabric at the beginning and end of each roll, plus the leftover at the end of each lay that's too short to use.
The mistake that keeps showing up: people apply one blended percentage — "add 8%" — and never separate these out. That single number hides everything. When you overrun, you have no idea whether it was shrinkage, a loose marker, or a bad fabric batch. Separating the adjustments is what makes the later audit actually useful.
Shrinkage: the allowance people guess at
Shrinkage is where guessing costs the most, because it compounds across the entire order.
Eliminate delays in your fashion production cycle.
GoTailo helps you manage designs, orders, and inventory effortlessly, keeping production on schedule.
- Centralized order and inventory management
- Real-time supplier communication
- Integrated production scheduling
No credit card required
A typical example: a cotton jersey tee, base marker consumption 1.15 m at 82% efficiency. The mill's spec sheet says 3% shrinkage. Your own relaxation test on the actual dye lot shows 5.5% length, 3% width. If you trust the spec sheet, you're short roughly 2.5% of length on every garment. On a 6,000-unit order, that's somewhere around 150–170 meters you didn't buy — which becomes a rush order at a premium, or a short shipment.
Knits especially: the wider the fabric and the higher the stretch content, the more the mill's spec and your actual results diverge. Test the real lot. Spec sheets are a starting point, not a consumption input.
For woven bottoms the shrinkage is smaller but the fabric is more expensive, so even a 2% miscalculation on a chino at $6/meter adds up fast across a range.
A quick shrinkage-to-consumption worked example
-
Base marker length
1.15 m
-
Marker efficiency
82% → gross ≈ 1.402 m
-
Length shrinkage (tested)
5.5% → 1.402 ÷ (1 − 0.055) ≈ 1.484 m
-
Defect + panel reject allowance
2% → 1.484 ÷ (1 − 0.02) ≈ 1.514 m
-
End-loss allocation (roll ends + short lay ends)
~1.5% → ≈ 1.537 m
Final per-garment consumption ≈ 1.54 m, versus a naive "1.15 + 8% = 1.24 m." That's a 24% gap between the lazy number and the real one. This is exactly how orders come up short.
Marker yield: where efficiency quietly leaks
Marker efficiency is the single biggest lever, and the one most people accept passively. If your CAD room hands you a marker at 78% and you don't push back, you're paying for that gap on every lay.
-
Size ratio matters. A marker built for a balanced S-M-L-XL ratio nests differently than one skewed heavily toward one size. Order the marker for your actual cut ratio.
-
Fabric width assumption. Markers are built to a nominal width — say 150 cm — but rolls come in at 148 or 152. If your marker assumes 150 and the fabric lands at 148, your efficiency drops in real cutting even though the CAD number looks fine.
-
One-way vs two-way nap. Napped, directional, or one-way-print fabrics kill efficiency because pieces can't be flipped. If the fabric is directional, your consumption goes up 3–8% depending on the shapes — budget for that upfront.
Measure incoming roll widths as they arrive and log them against the marker width used for the PO; a quick width check prevents repeated width-assumption overruns.
Most consumption errors on structured garments (blazers, tailored bottoms) trace back to nap and directional constraints that weren't reflected in the original marker assumption.
Consumption by garment type — realistic allowance ranges
Different garments carry different risk. Here's a breakdown of where the adjustments typically land. Treat these as starting ranges to sanity-check your own numbers, not gospel.
| Garment type | Base marker eff. | Shrinkage allowance | Defect/reject allowance | End-loss | Notes |
|---|---|---|---|---|---|
| Cotton jersey tee | 80–85% | 4–6% (test the lot) | 1.5–3% | 1–2% | Width shrinkage matters for body fit |
| Fleece hoodie | 78–83% | 5–8% | 2–4% | 1.5–2.5% | Panel rejects higher due to shading |
| Woven shirt | 82–87% | 1.5–3% | 1.5–2.5% | 1–2% | Directional stripes/checks reduce eff. |
| Chino / woven pant | 80–85% | 1.5–2.5% | 2–3% | 1.5–2% | Expensive fabric — small errors cost more |
| Knit dress | 76–82% | 4–7% | 2–3.5% | 1.5–2.5% | Large panels, nesting harder |
| Structured blazer | 72–80% | 1.5–3% | 3–5% | 2–3% | Nap/directional + interlining complexity |
Structured and napped garments carry the highest total uplift, and they're usually cut from the most expensive fabrics too. That combination produces the ugliest overruns.
The part everyone skips: auditing BOM against actual roll usage
Calculating consumption well is half the job. The other half is checking whether your calculated number matched what actually got consumed — and doing it every order, not once a year.
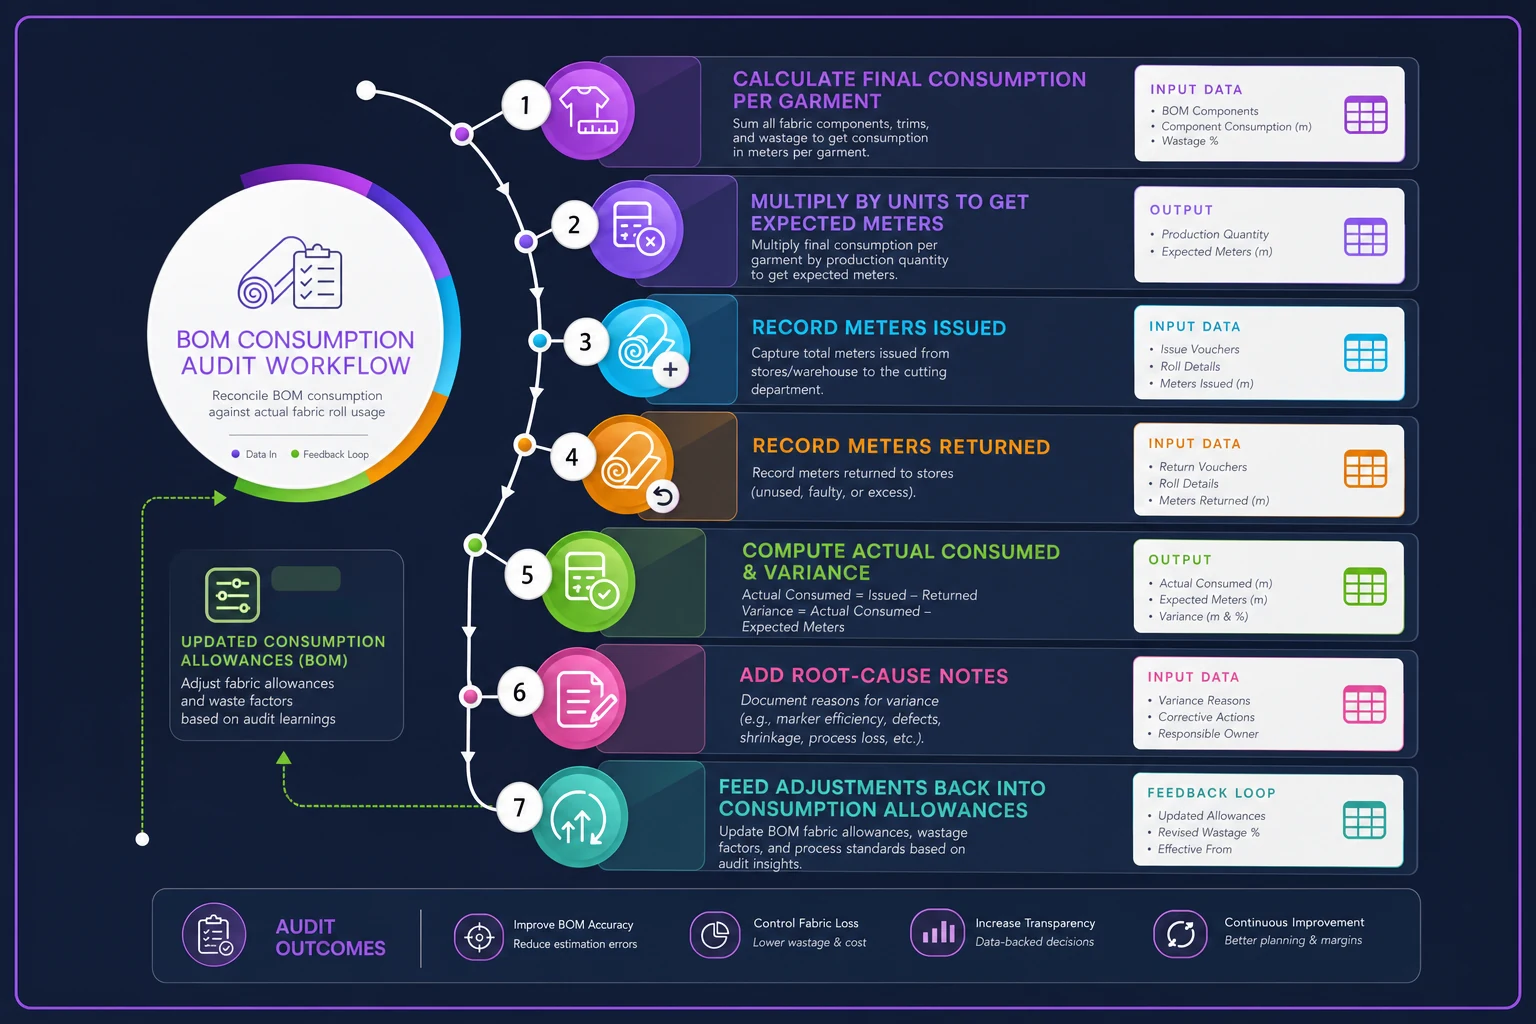
Expected fabric used = Final consumption per garment × units cut Actual fabric used = Total meters issued from rolls − meters returned to store Variance = Actual − Expected
If actual consistently exceeds expected, either your allowances are too low or there's waste on the floor. If actual is consistently below expected, you're over-buying and tying up cash in inventory.
A simple audit spreadsheet layout
-
Style / PO number
-
Fabric code + dye lot
-
Units cut
-
Final calculated consumption/unit
-
Expected total meters (units × consumption)
-
Meters issued from store
-
Meters returned to store
-
Actual consumed (issued − returned)
-
Variance meters (actual − expected)
-
Variance %
-
Root-cause note (shrinkage / marker / defects / lay ends / theft-shrinkage)
The root-cause note column is what turns this from a spreadsheet into a feedback loop. Without it you just have numbers. With it, after five or six orders you start seeing that your fleece consistently runs +3% over on defect allowance — so you raise the allowance and the overruns stop.
Here's a simple audit workflow visualization.
A worked audit example
-
Final calculated consumption
1.68 m/unit
-
Expected total
4,000 × 1.68 = 6,720 m
-
Issued from store
7,050 m
-
Returned to store
120 m
-
Actual consumed
6,930 m
-
Variance
+210 m (+3.1%)
A 3.1% overrun on one order isn't a crisis. But the root-cause note revealed the fabric came in at 146 cm against a marker built for 150 cm — a width assumption error. Fix the marker width input and that 210 m disappears on the next run. Multiply that across a season and you've recovered real money that was quietly leaking out.
Where the numbers usually go wrong
A checklist to run before you commit consumption to a purchase order:
-
Did you test shrinkage on the actual dye lot, not the spec sheet?
-
Is the marker built for the real cut ratio, not a balanced average?
-
Does the marker width match the received fabric width?
-
Did you separate shrinkage, defect, and end-loss into distinct percentages?
-
Is there a specific allowance for directional/napped fabric if applicable?
-
Did you account for short lay ends on smaller cut quantities?
-
Is the previous style's audit variance feeding into this style's allowances?
That last point separates teams that keep overrunning from teams that don't. If you never feed the audit back into the calculation, you'll make the same 3% mistake every season.
When tight consumption math actually matters — and when it doesn't
When it's worth the effort: high-volume repeat programs, expensive fabrics (wool, technical, imported), and directional or napped materials. On these, a 3% error is real money and it repeats.
When you can be looser: one-off sample runs, tiny quantities, or cheap commodity knits where the cost of over-precise math exceeds the fabric you'd save. Spending two hours perfecting consumption on a 50-unit capsule probably isn't worth it.
Who should not obsess over this: if you're cutting fewer than a few hundred units total across a season and buying off cheap open stock, a solid blended allowance and a quick after-the-fact check is plenty. The audit routine matters most once you're placing real POs against real lead times, where a short order costs you a delivery window.
Real scenario
A contract manufacturer running mostly fleece and jersey basics — roughly 40k–50k units a season — kept running about 6–9% over on fabric across their fleece styles. They blamed the cutting floor. When they actually built the layered consumption calc and ran the roll-usage audit for one season, the root-cause notes told a different story: about two-thirds of the overrun came from untested shrinkage (they trusted mill specs) and directional pile they never budgeted for. The floor was fine.
After correcting the shrinkage inputs per dye lot and adding a directional allowance, their fleece variance dropped to around +1.5% within two production cycles. On their fabric spend that worked out somewhere in the range of $18k–$25k recovered over the season — money that had been disappearing into over-orders and rush buys.
Nothing about that required new equipment. It required separating the allowances, testing the actual fabric, and comparing the BOM number to the roll number every order.
Closing thought
Fabric consumption isn't a one-time calculation you do at costing and forget. It's a number that should get more accurate every season because you're feeding real roll usage back into it. Teams that treat it as static keep making the same allowance error indefinitely. Teams that audit — even with a plain spreadsheet — tighten their numbers until overruns stop being a surprise line item.
Build the layered calc, test the actual fabric, and reconcile BOM against rolls every order. The math is tedious, but it's probably the cheapest margin you'll ever recover.
Ready to tailor your apparel operations?
Join 500+ fashion brands using GoTailo to accelerate product launches, reduce waste, and improve supplier collaboration.